Logs
Understanding your logs
The Logs tab shows the raw clicks, conversions, postbacks and cost updates behind your LeadJourney reports. Learn where to find them and the tools — filters, columns, sorting and CSV export — that work across every log.
Your reports show the summary – campaigns, revenue, ROAS. The Logs tab shows the raw data underneath them: every single click, conversion, postback and cost update that LeadJourney recorded. It's the place to go when you want to confirm a specific click came through, check why a conversion isn't attributed, debug a postback to your ad network, or simply export the underlying rows for your own analysis.
Who can see the Logs tab
The Logs tab only appears for users who have the Logs permission. If you don't see it in Settings, ask your workspace owner to grant you access on the Sub-users tab.
Where to find your logs
In LeadJourney, open Settings → Logs, or go straight to app.leadjourney.io/settings?slug=logs.
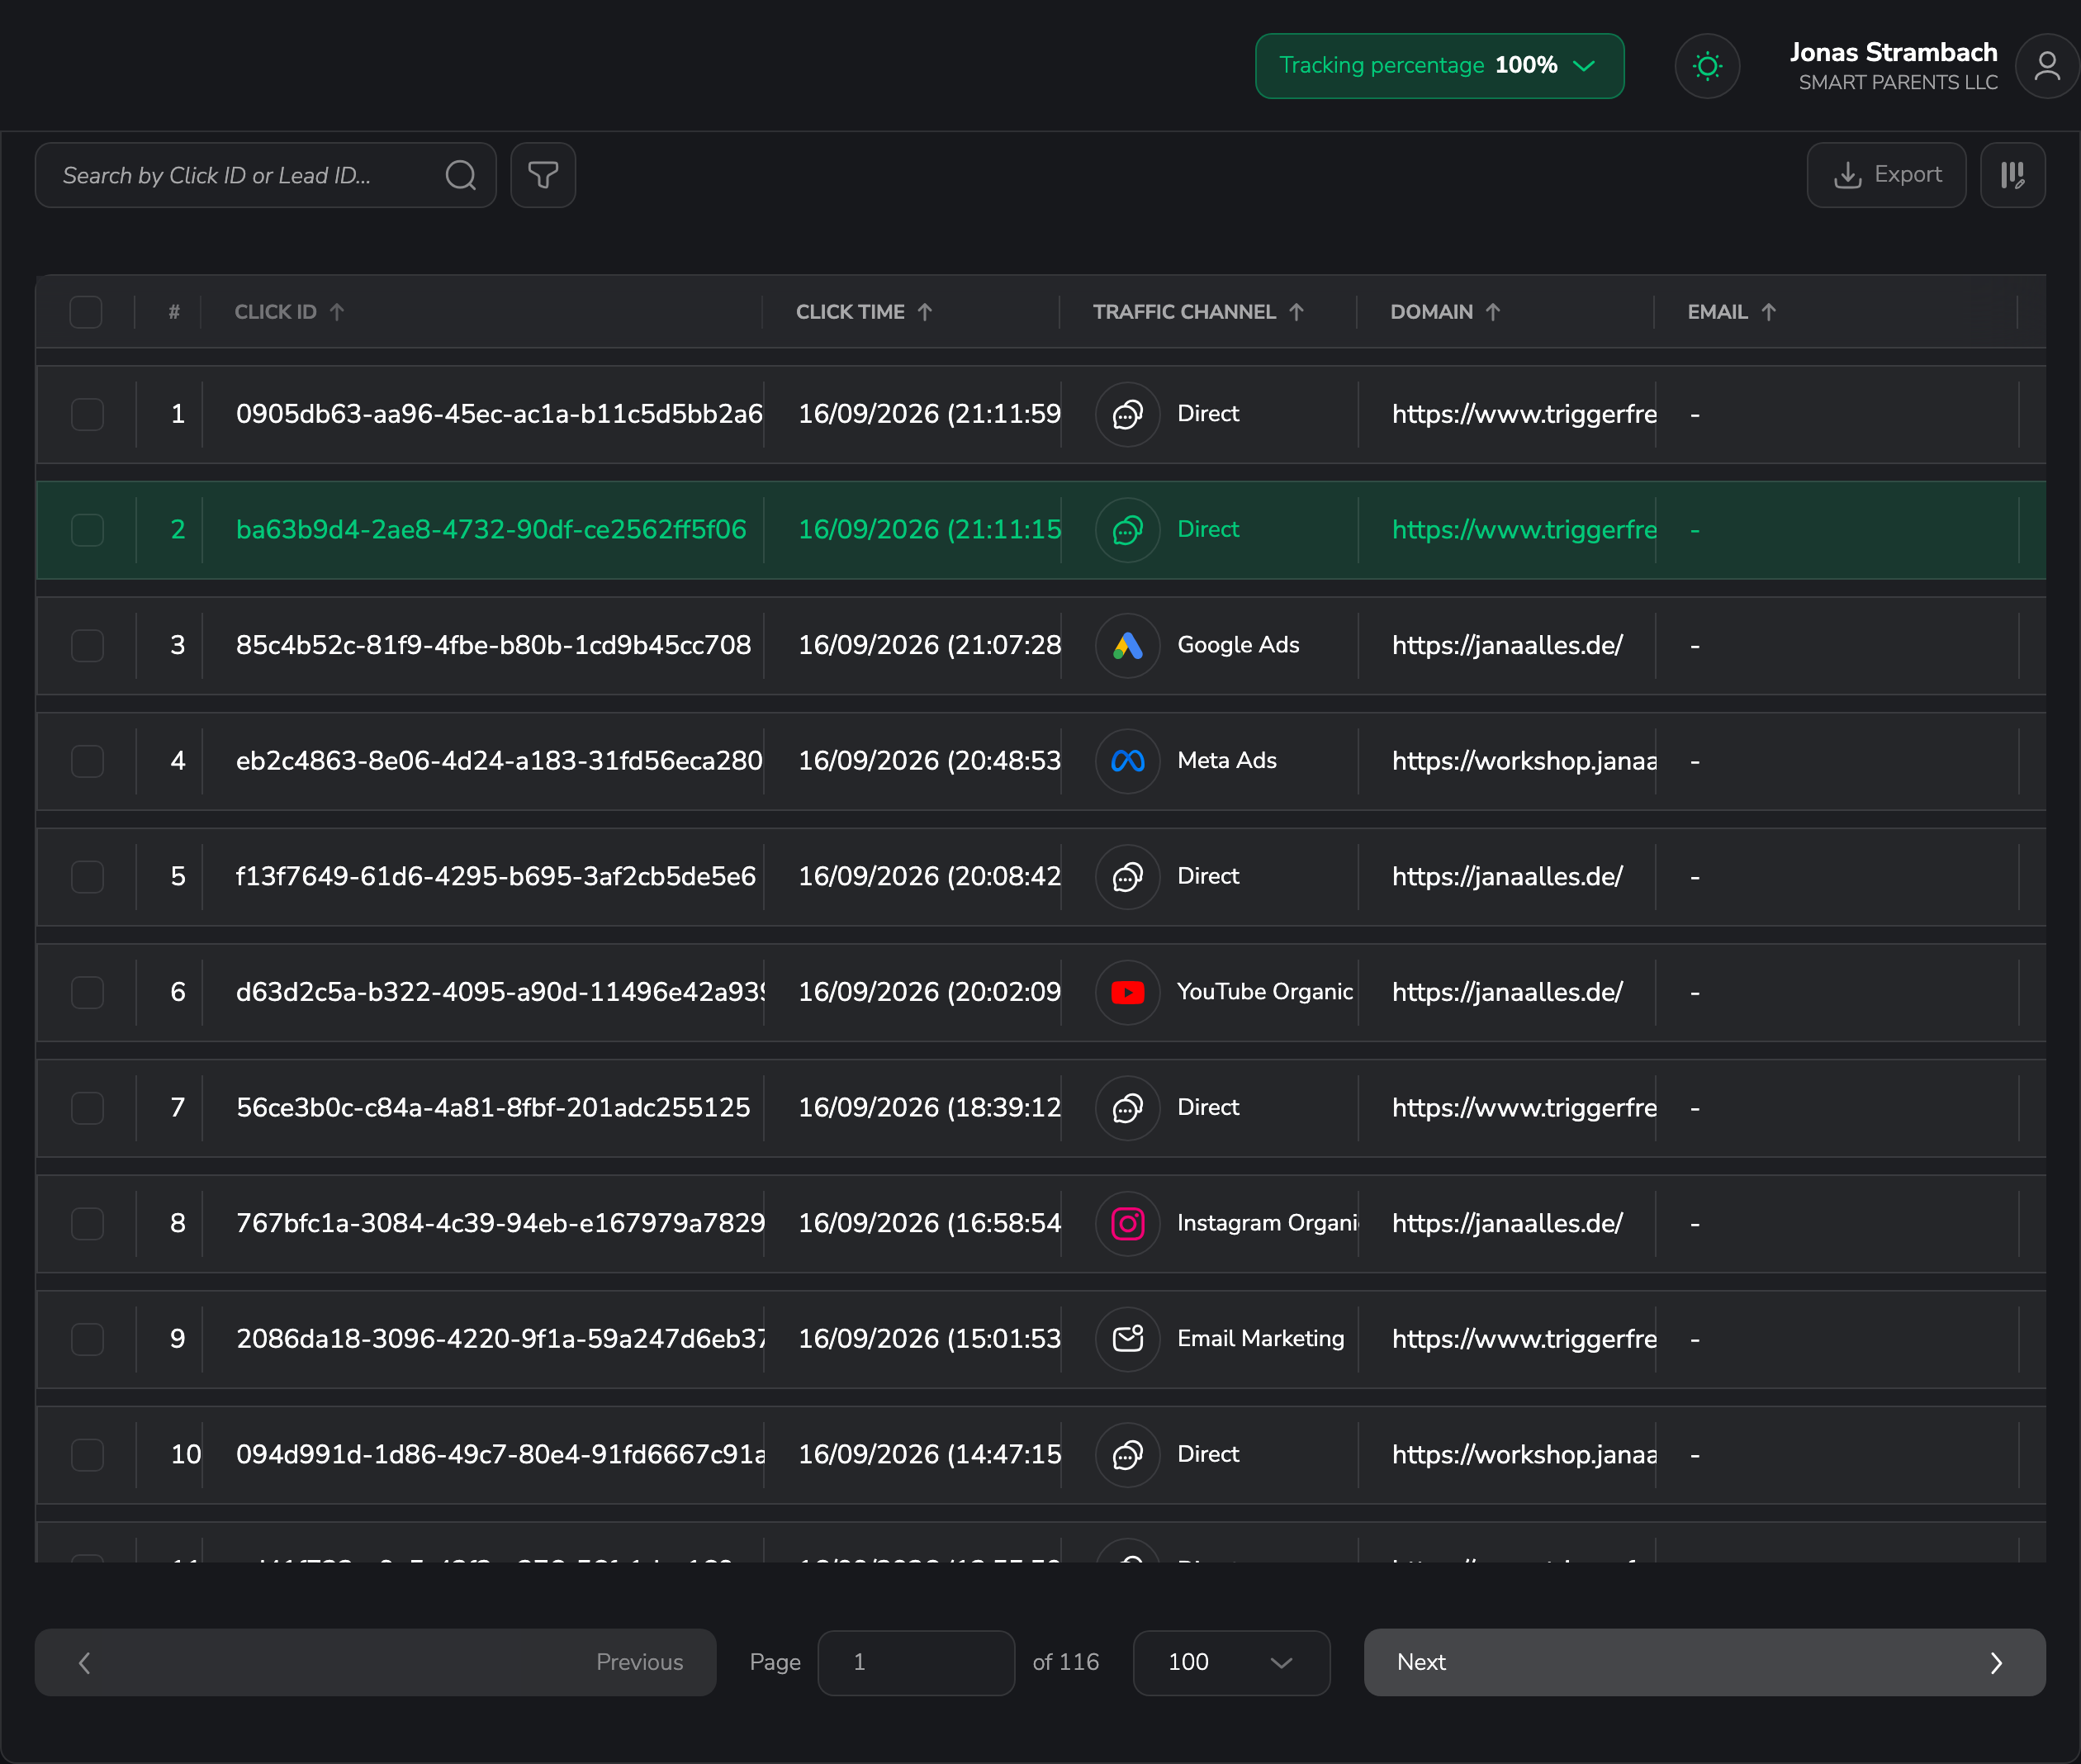
The four log types
Inside the Logs tab you'll find four sub-tabs. Each one is a separate table with its own columns, filters and export – and its own article that walks through what it records and how to read it.
Clicks Logs
One row per inbound click – visitor, device, channel and the campaign attribution behind it.
Conversions Logs
One row per conversion attributed to a click, with revenue, cash collected and lead details.
API Postbacks
The postbacks LeadJourney sent out to your traffic sources, their status and raw payload.
Cost Updates
The cost/spend records imported from your channels, used to calculate ROAS and profit.
Tools that work on every tab
The four tables differ in what they show, but the controls for working with them are the same everywhere. The per-log articles cover the data; this section covers the shared tools.
Timestamps and currency
Money columns (Revenue, Cash Collected, Spend) use your workspace currency, and dates follow your workspace time zone – except the Cost Updates Date Created (UTC) column, which is always shown in UTC. See Change your workspace currency and Change your workspace time zone.
Filter your logs
By default each tab loads the current month (from the 1st to today). Use the filter row to narrow things down – the available filters depend on the tab:
- Time period – pick a custom date range (all tabs).
- Traffic channel – filter to one or more channels (Clicks Logs lets you multi-select; the other tabs are single-select).
- Conversion Type – on Conversions Logs, show a single conversion type.
- Campaign – on API Postbacks, narrow to one campaign.
- Search by Click ID – type a Click ID to jump straight to a specific click or its related conversion/postback.
- Advanced filters – open the sidebar to build conditional rules with AND/OR logic (for example, Country is DE and Device is Mobile). The fields you can filter on match the columns of that tab.
LeadJourney remembers your filters per tab, so when you come back they're still applied. If the end date you'd saved is now in the past, it automatically snaps forward to today so recent rows aren't hidden. Use Reset to clear all filters at once.
Customize the columns
Click Column Settings to tailor each table to what you care about:
- Show or hide any non-mandatory column.
- Reorder columns by dragging them into the order you want.
- Resize column widths directly in the table by dragging the column borders.
- Reset Columns restores the original set and order.
A few columns are mandatory (such as the row number # and Click ID, or Status
on API Postbacks and Campaign Name on Cost Updates) – these stay visible and can't be
moved. Your layout is saved in your browser per tab, so each log type keeps its own setup.
Sort and page through results
- Sort by clicking a column header – click once for ascending, again for descending.
- Paginate with the controls at the bottom. Choose how many rows to show per page (10, 25, 50 or 100) and jump between pages.
Export to CSV
Click Export to download the raw data as a .csv file. You choose what to include:
- Download current page view – just the rows currently on screen, respecting your filters and sorting.
- Export all data from the table – every row that matches your current filters, not just the visible page.
You can also tick the checkboxes on specific rows and export only the selected rows from the bulk-action bar. The CSV includes your visible columns in their current order.
Related articles
Billing & subscription
How billing works at LeadJourney – plans are purchased through a secure checkout, and changes to your subscription, invoices or cancellation are handled by the LeadJourney team rather than inside the dashboard.
Clicks Logs
One row per inbound click redirected through LeadJourney's tracking — visitor IP, location, device, the traffic channel and the full campaign attribution behind every click.