Features
Campaign Report
Drill into campaign performance across every channel, then expand campaign → ad set → ad/keyword. Group each level by country, device, OS and more to find the winners to scale and the losers to cut.
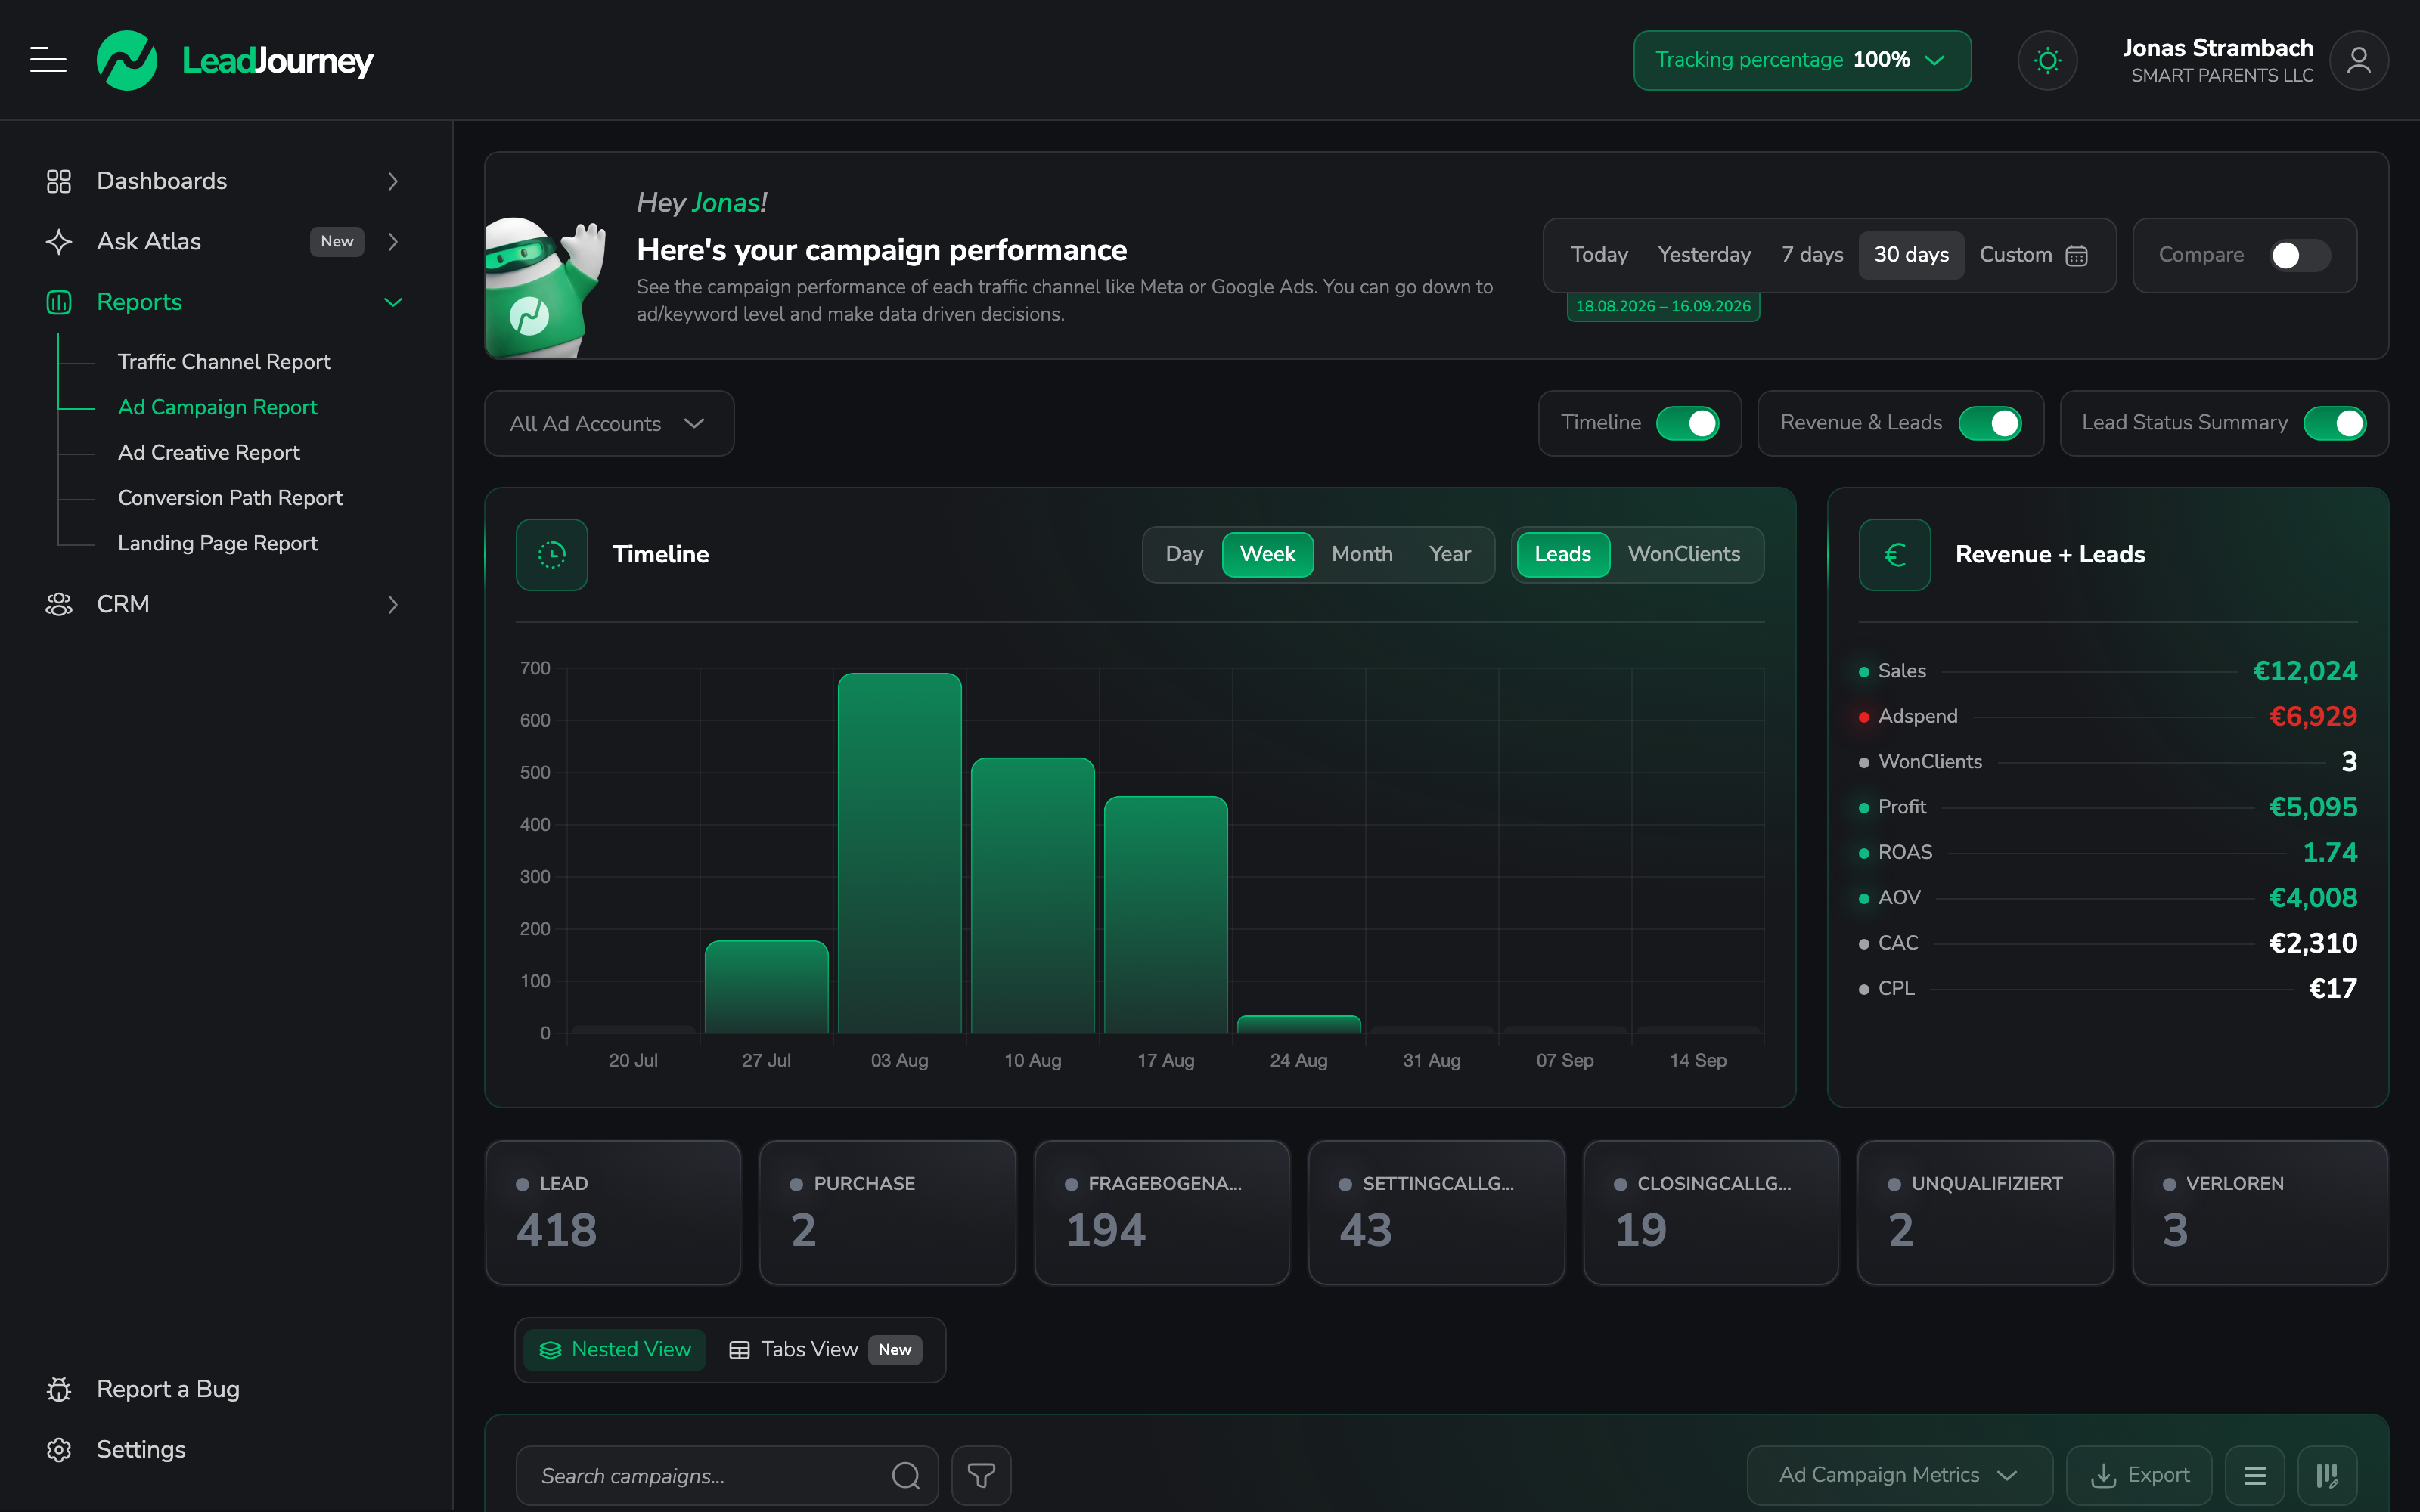
The Campaign Report is where you do the day-to-day work of optimisation: find the campaigns that produce cheap, high-quality leads, and the ones quietly burning budget. It spans every channel and lets you drill all the way down to the individual ad or keyword.
Where to find it
Open Reports → Campaign Report, or go to app.leadjourney.io/?slug=campaign-report.
What it shows
Each row is a campaign, with a status badge and the metrics you choose via column presets – clicks, leads, CPL, won clients, revenue, ROAS and more. Expand a campaign to reveal its ad sets, and expand an ad set to see its ads / keywords.
Group by any dimension
Instead of the default campaign → ad set → ad hierarchy, you can break each of the three levels down by a dimension using the stacked group-by selectors – Country, City, Device, OS, Browser, ISP or a custom field. For example: campaigns, then within each campaign group by Country, then by Device.
Controls & row actions
- Date range, Compare to previous period, attribution method / window / date mode.
- Search by campaign name, filter by status (All / Active / Inactive), an affiliate-only toggle and advanced filters.
- Sortable columns with saveable presets.
- Click a campaign to open its detail – the journey, clicks and sales behind it.
From a number to the people
Click the leads/sales icon on any row to open Lead Overview filtered to that campaign (and ad set / ad, if you've drilled in).
Related articles
Channel Category
The level above your traffic channels – Paid Social, Paid Search, Organic Search, AI Search, Organic Social, Direct, Referral and Other. Compare whole surfaces instead of individual channels, in the Traffic Channel Report and the Report Builder.
Landing Page Report
See how each landing page converts across every traffic source – clicks, leads, conversion rate, won clients and revenue, with a per-page conversion trend. Group a page's traffic by channel, campaign, device and more.