Features
Report Builder
Build custom reports from any metric, dimension, date range and filter – then visualise them as a chart or table and pin them to a dashboard. LeadJourney's flexible reporting tool.
The Report Builder is where you turn LeadJourney's tracking data into exactly the report you need. Pick your metrics, choose how to group the data, set a date range, add filters, and watch a live chart or table update as you go. When it looks right, add it to a dashboard so it's one click away next time.
In short
Everything is built in one screen: configure the report on the left, see it render live on the right. No metric is calculated until you press save – you're always looking at real data. When you're happy, Add to Dashboard keeps the report for later.
Where to find it
In the left sidebar open Reports → Report Builder, or go straight to app.leadjourney.io/?slug=report-builder.
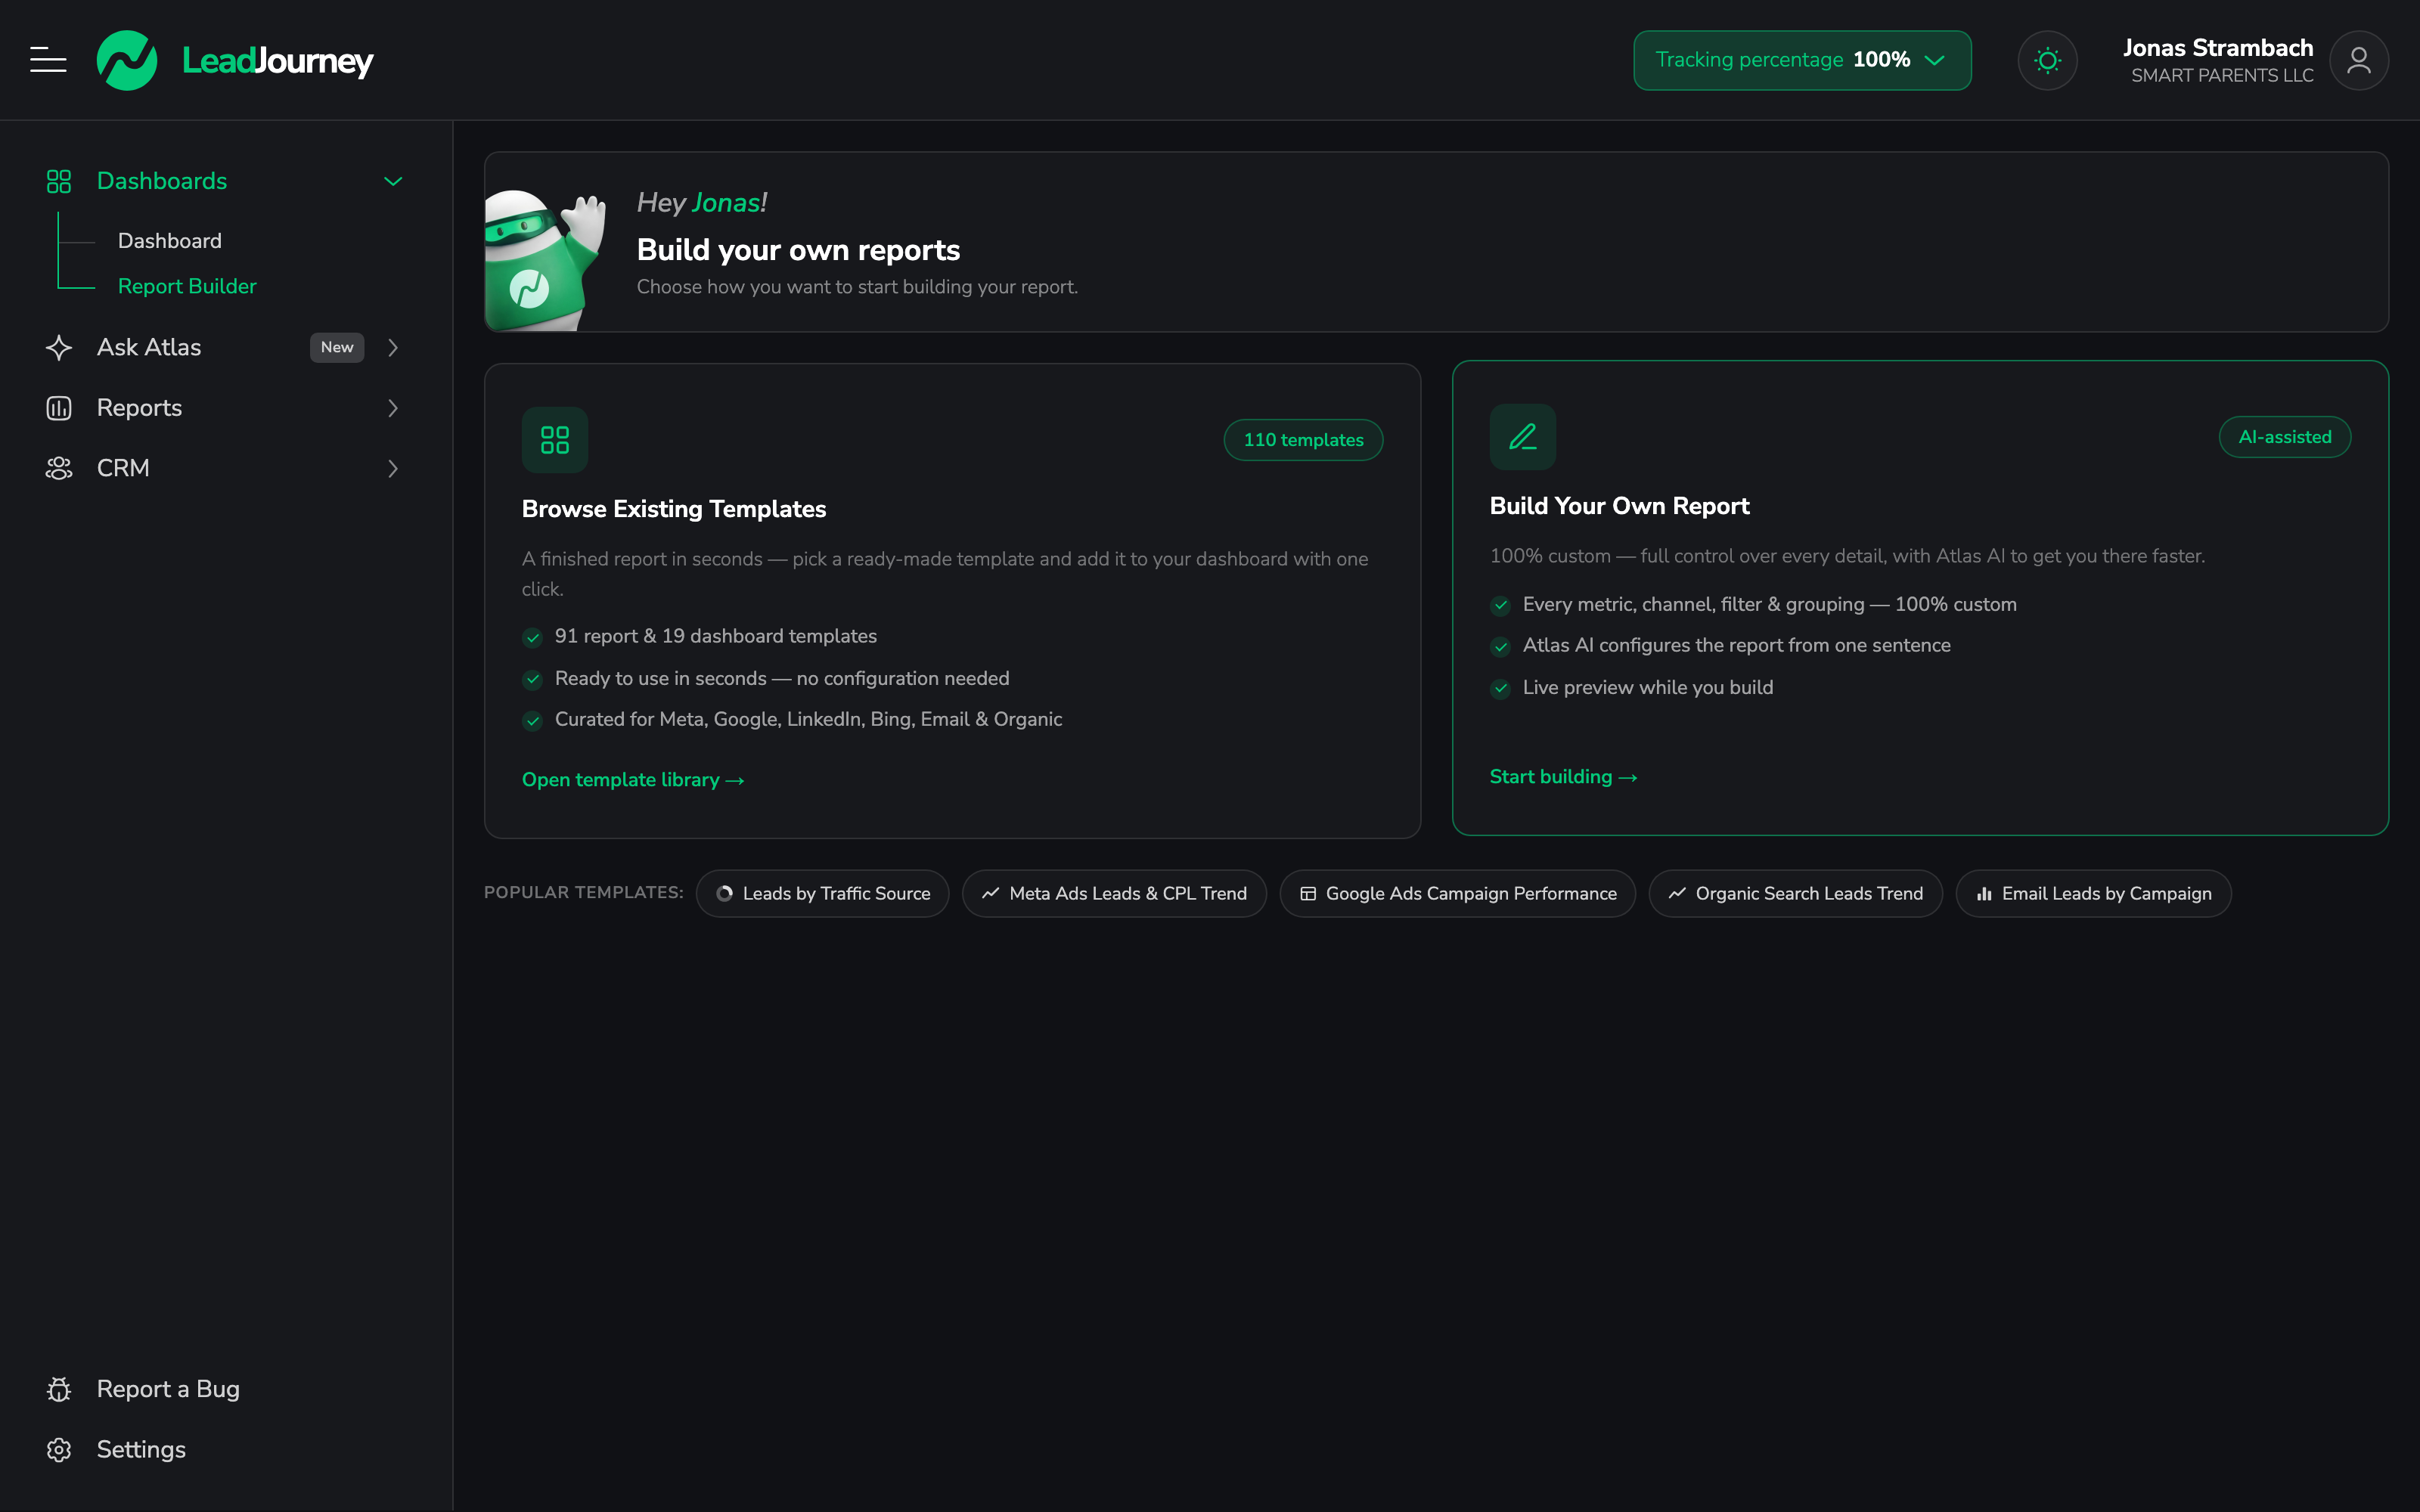
The screen has two halves:
- Left – the configuration panel. Two tabs: Report (what to show) and Settings (how it looks).
- Right – the live preview. Your chart or table, updating as you change the settings.
At the top-right is the Add To Dashboard button (it reads Save to Dashboard when you're editing a report that's already on a dashboard).
The fastest way: Build with Atlas AI
At the top of the Report tab is a Build with Atlas AI panel – "Describe the report you want and Atlas will configure it for you." Type a request in plain language and Atlas fills in every setting for you. You can then tweak anything by hand.
Example prompts (these are shown as clickable suggestions):
- Leads from Meta Ads in the last 30 days, grouped by campaign
- Cost per Lead by traffic channel this month
- Top 10 ad groups by Won Clients this quarter
- Compare CPL and ROAS week over week
- Total leads and revenue by affiliate network this month, bar chart
Atlas just configures – you stay in control
Atlas only sets up the report's metrics, grouping, date range and filters. Nothing is saved until you press Add to Dashboard, so feel free to ask, adjust, and ask again. Want to ask questions about your data instead of building a report? See Ask Atlas.
Build a report step by step
These are the sections of the Report tab, in order. You can fill them in any order – the preview updates after each change.
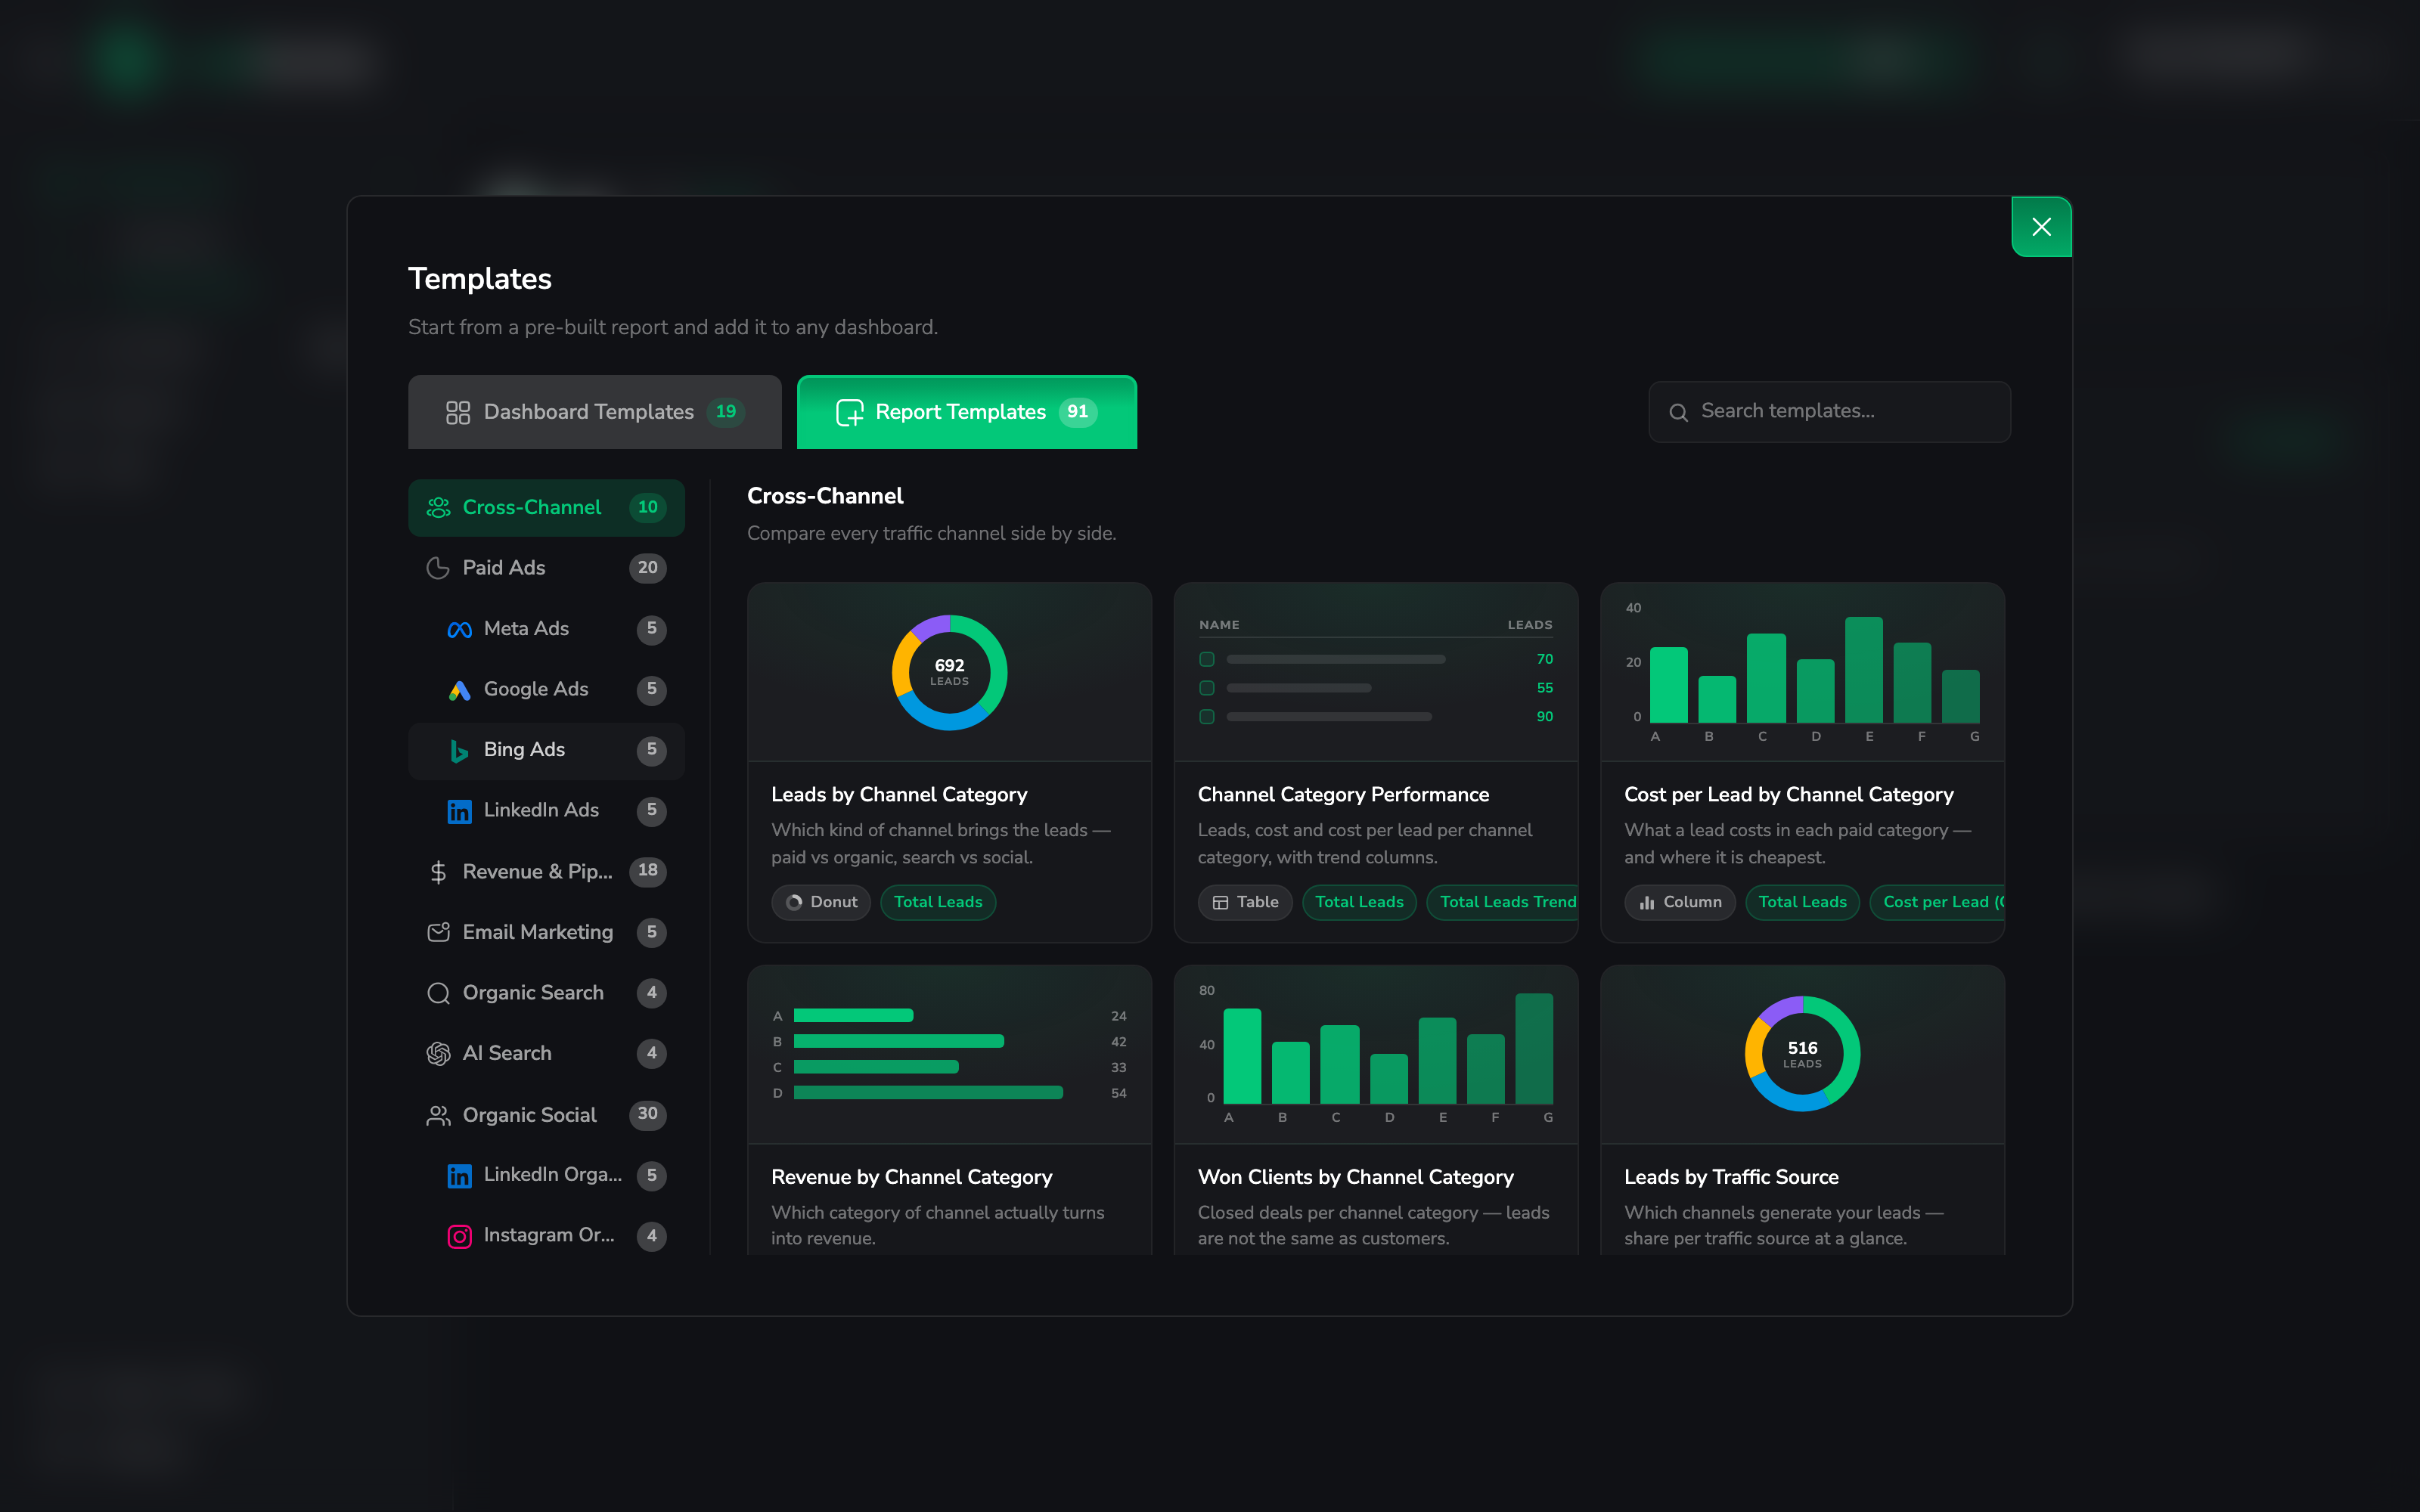
Name your report
At the very top, give the report a Report Name. This is the title shown on the chart and on the dashboard card later.
1. Choose report style
Pick how the data is drawn:
| Style | Best for |
|---|---|
| Line | Trends over time (the default). |
| Column | Comparing values side by side (vertical bars). |
| Bar | The same, but horizontal – ideal for long names like campaigns. |
| Area | Trends where you want the volume under the line emphasised. |
| Table | Exact numbers, many metrics at once, sortable columns. |
You can switch style at any time without losing the rest of your setup.
2. Choose date range
Open the date picker and pick a preset or a custom range. Presets include Today, Yesterday, This Week, Last Week, This Month (the default), Last Month, This Quarter, Last Quarter, This Year, Last Year and All Time.
For more control there's Custom Range (pick an exact start and end), Rolling Date Range (e.g. the last 14 days, which keeps moving forward), plus Equal To, Before and After for single-date boundaries.
Compare to a previous period
Turn on Compare to Previous Period in the Settings tab to show the percentage change versus the matching earlier period. It's unavailable for ranges that have no comparable period (All Time, Before, After).
3. Choose metrics
Click Add Metrics and pick what to measure. Metrics are grouped into categories – General, Lead Generation, Revenue, Profit, Offline Conversions and more (see the full list below). Search by name, tick as many as you need, and they appear as removable tags. In a table each metric becomes a column; in a chart each becomes a series.
Metric windows – compare lookback periods
Click into a metric to add a window: as well as Match Report Range (the default), you can pull the same metric for the Last 7 / 14 / 30 / 60 / 90 Days. So you could show Cost, CPL, and CPL — Last 7 Days side by side. Windows are anchored to the report's end date, so a saved report always shows the same thing. You can use up to 6 distinct windows in one report.
4. Choose traffic channels
Narrow the report to specific sources, or leave it empty to include everything. Channels are grouped:
- Paid Ad Channels – Meta Ads, Google Ads
- Organic Search – Google, Bing, Yahoo, DuckDuckGo
- AI Search – ChatGPT, Gemini, Perplexity, Claude, Grok, Copilot, DeepSeek
- Organic Social – Pinterest, Instagram, Facebook, YouTube, LinkedIn, TikTok
- Others – Direct, Referral
5. Add filters
Click Add Filter to add a row-level condition. Each filter has three parts: a field, a condition, and a value.
Filterable fields include Country, Device, Landing Page, Campaign Name, Ad Group, Ad / Keyword, Traffic Channel, Medium, Tag, Affiliate Campaign, Affiliate Offer and Affiliate Network.
Text fields support Is equal to, Is not equal to, Contains, Does not contain, Starts with and Ends with. Add several filters to combine them – all conditions must match (AND). Each active filter shows as a tag; click its × to remove it.
Filter by Tag
The Tag filter lets you slice a report by the campaign tags you've set up. See Organise campaigns with tags.
6. Choose attribution method
Pick how conversion credit is assigned across a visitor's journey:
- Last Click (default, most popular) – full credit to the last source clicked before converting. Matches the default model in Meta, Google Ads and most ad platforms; best for judging what closes.
- First Click – full credit to the first source clicked, revealing which channels start the funnel and drive discovery.
The picker shows a short Why use it / When to use it / Example for each model so you can pick with confidence. For a deeper look at each model and the window settings, see Attribution models.
Group by
Choose how rows are broken down. Pick Time to see a trend, or a dimension to compare sources against each other.
- Time – set the granularity (Day, Week, Month, Quarter, Year) and optionally tick Display only dates with data to skip empty periods.
- A dimension – Traffic Channel, Campaign, Ad Group, Ad / Keyword, Country, City, Keyword, URL Parameters, Affiliate Campaign / Offer / Network (plus any custom fields you've made available in reports). For dimensions you also set Sort by (which metric), Ascending / Descending, and Show Top 5 / 10 / 15 / 20.
Use Add Another Group By to break the data down by more than one dimension at once (for example, campaign and country).
Fine-tune the look (Settings tab)
Switch to the Settings tab to control presentation:
| Setting | What it does |
|---|---|
| Metric Colors | Pick a colour per metric from the swatches, or paste a custom hex code. |
| Show Totals | Shows the total for each metric above the chart. |
| Compare to Previous Period | Adds the % change versus the previous period (see the date-range note). |
| Stacked Chart | Stacks series on top of each other instead of side by side. |
| Display Trendline | Overlays a trend line so direction is obvious. |
| Show Data Labels | Prints the value directly on each point or bar. |
Available metrics
Metrics live in categories in the picker. Lead and client metrics use your workspace's names – if you've renamed "Leads" or "Won Clients", the labels here follow suit.
| Category | Metrics |
|---|---|
| General | Cost, Clicks (Links), Clicks (All), Impressions, Reach, Frequency, Ads Conversions |
| General (Advanced) | Clicks, Cost per Click (CPC), Click-Through Rate (CTR), Cost per 1000 Impressions (CPM), CPC (All), CTR (Links), CTR (All), Impression Share |
| Lead Generation | Total Leads, Leads (New), Leads (Existing), Lead Conversion Rate (CR), Cost per Lead (CPL), Cost per New Lead, Landingpage Clicks |
| Lead Generation (Advanced) | Sales Cycle (Days), Lead to Won Client Rate |
| Revenue | Total Revenue, Cash Collected, Average Order Value, Earnings per Click, Revenue per Lead, Cash per Lead, Return on Ad Spend (ROAS) |
| Profit | Profit, Profit per Lead, Profit on Ad Spend (POAS), Return on Investment (ROI), Customer Acquisition Cost (CAC) |
| Offline Conversions | Won Clients, Won Clients Revenue, plus a Number / CPA / CR set for every custom conversion type |
Currency metrics use your workspace currency; rates and ratios show as percentages. If a currency symbol looks wrong, see How do I change my workspace currency?
Cost, CPL and ROI need cost data
Profit, ROI, CPL and the other cost-based metrics are only accurate when LeadJourney knows your spend. Paid ad spend syncs automatically; add everything else (SEO, email, freelancers) under Channel Costs.
Save a report to a dashboard
The Report Builder doesn't keep a standalone copy of your report – instead you pin it to a dashboard, where it lives as a card you can revisit any time.
Open the dashboard menu
Click Add To Dashboard in the top-right.
Pick a dashboard
Choose an existing dashboard from the list (each shows how many reports it already holds), or click Create New Dashboard to make one on the spot.
Done
The report is saved to that dashboard with all of its settings – style, metrics, grouping, date range, filters, attribution and colours.
To change a saved report later, open it from its dashboard. The Report Builder loads with every setting filled in, the button now reads Save to Dashboard, and saving updates the existing card.
Common questions
Related articles
AI Agents
Run a report on a schedule and deliver it to email, Slack or a webhook.
Attribution models
How first-click and last-click change the numbers in your reports.
Track channel costs
Add non-paid spend so CPL, ROI and profit are accurate in every report.
Organise campaigns with tags
Group campaigns so you can filter and break reports down by tag.
Atlas Settings
Tune the Atlas AI assistant for your workspace – give it your marketing goals, choose which model it uses, and connect it to MCP clients and Slack.
Dashboards
Pin your saved reports as cards on a dashboard so the numbers you care about are one click away. Create multiple dashboards, arrange the cards in a grid, and jump back into any report to edit it.