Features
Traffic Channel Report
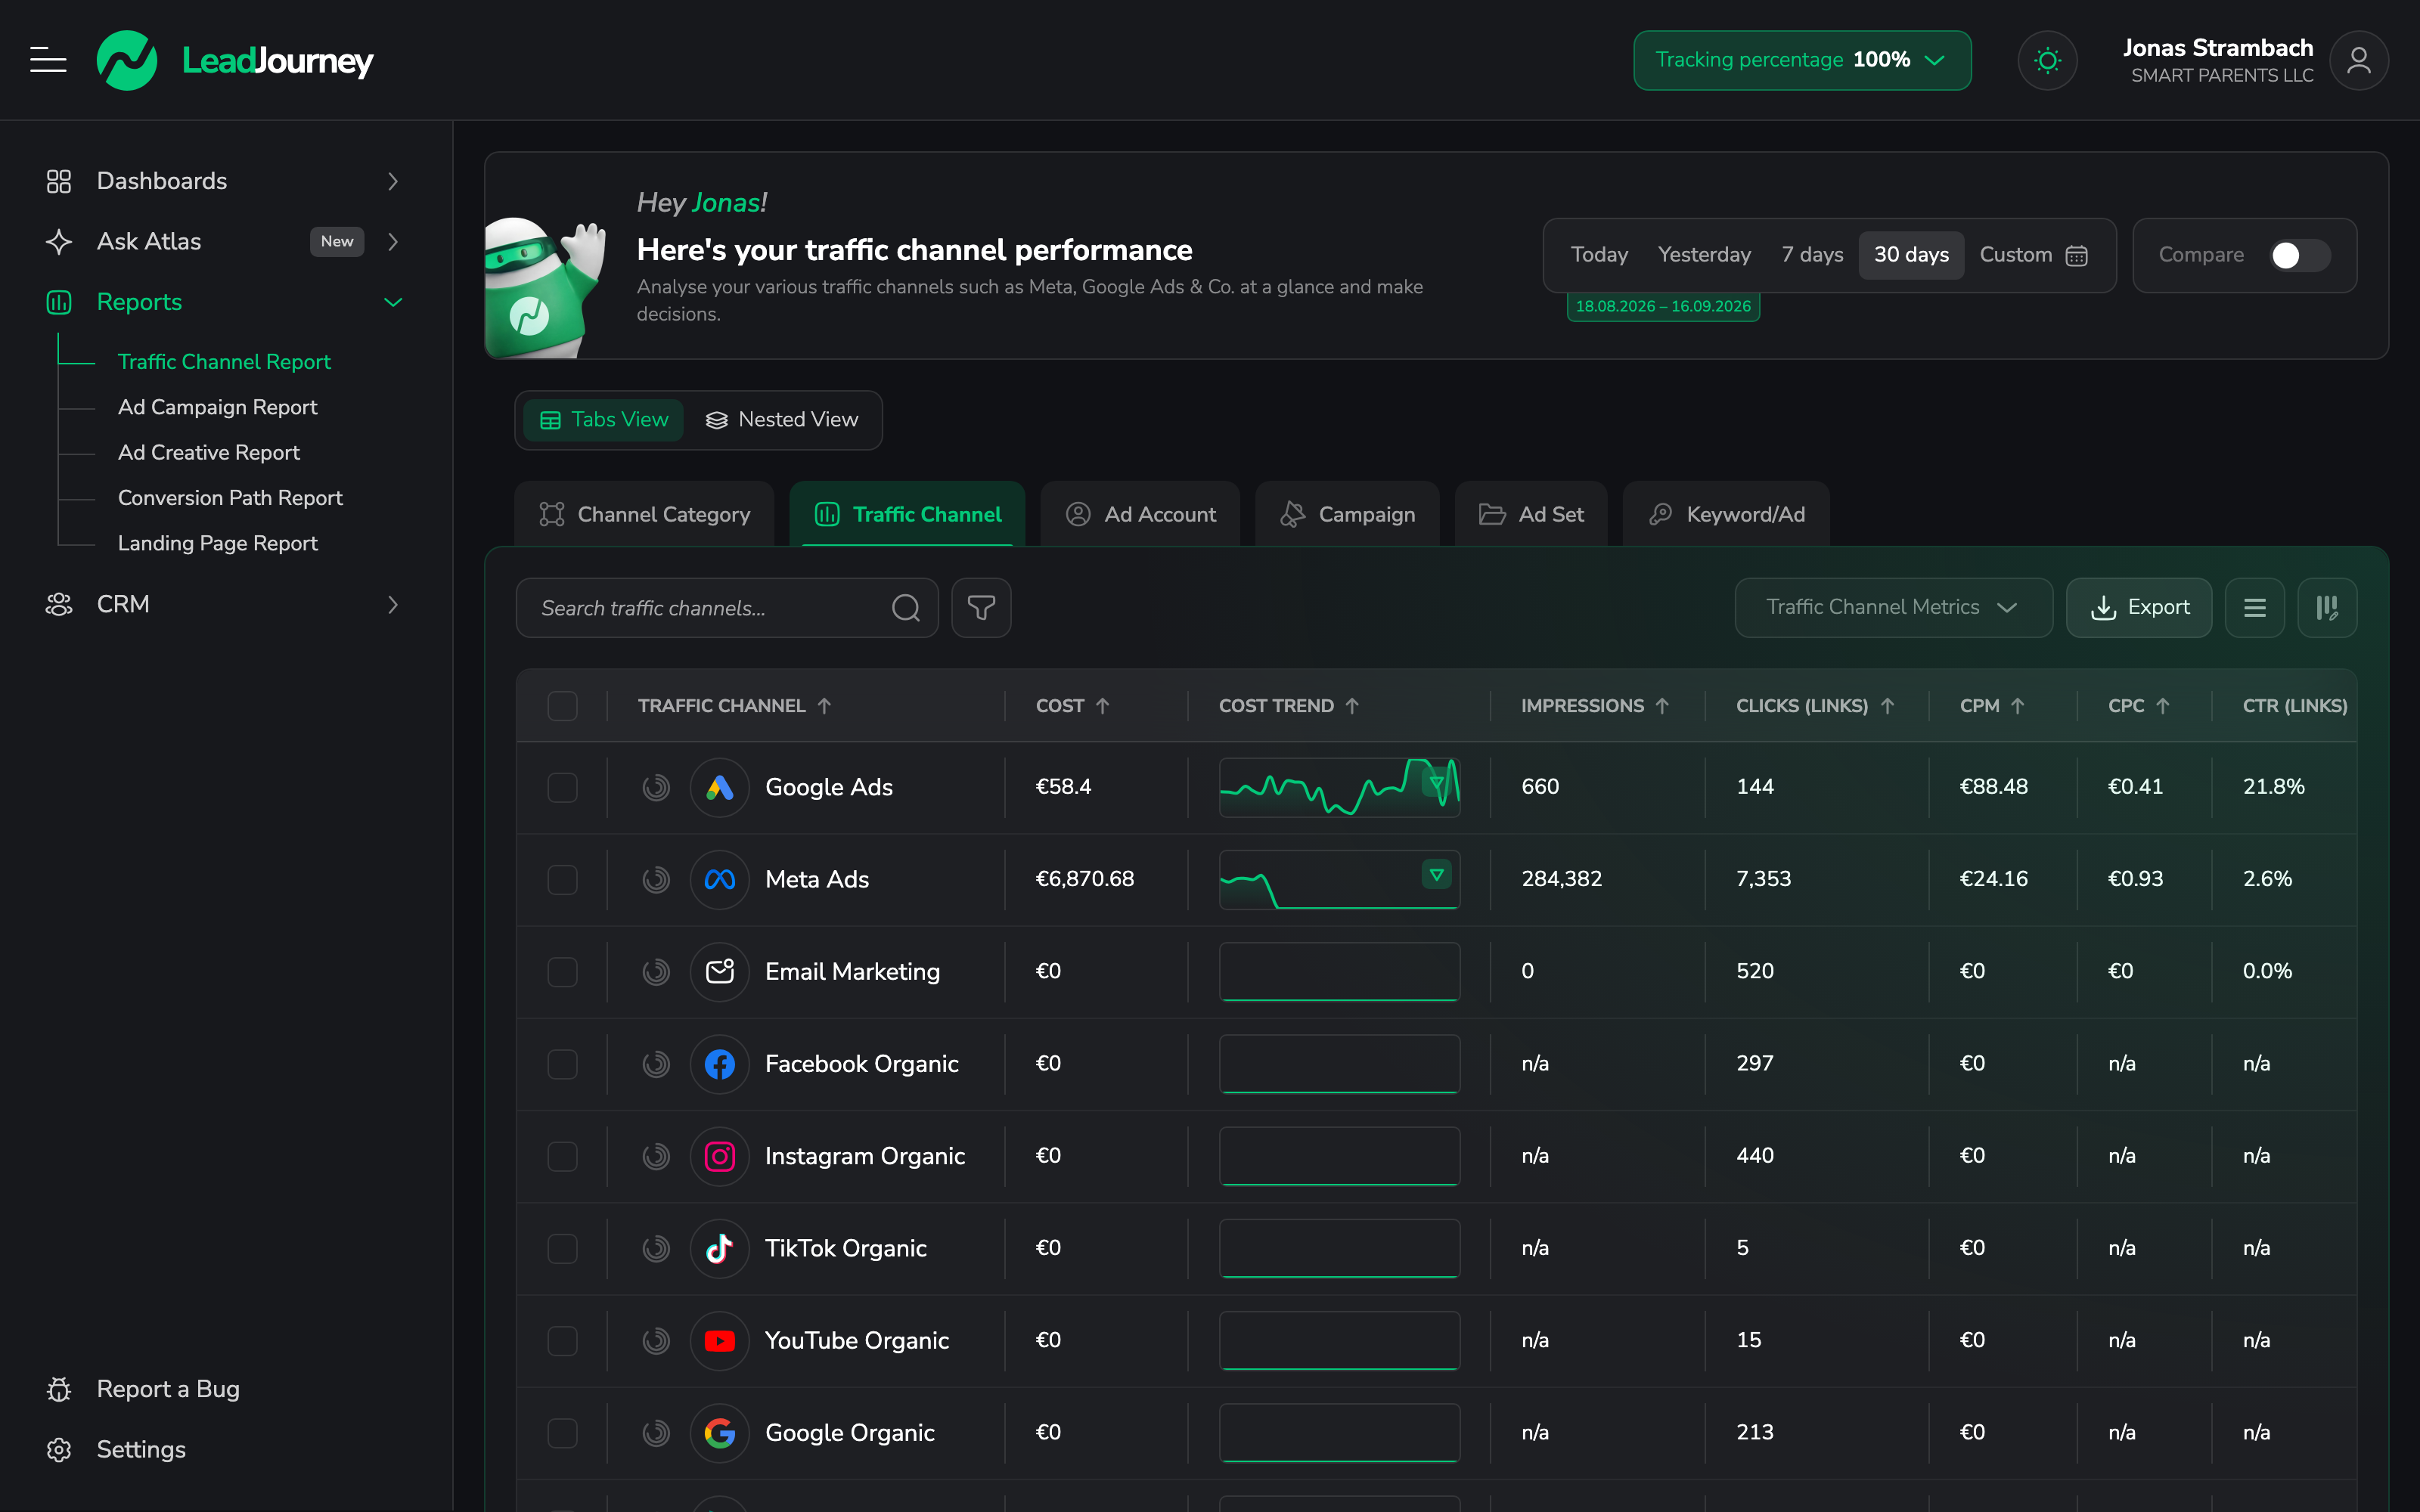
Compare every paid and organic channel side by side – clicks, cost, leads, CPL, won clients, revenue, ROAS and profit – then drill from a channel down to its campaigns, ad sets and ads to see where your budget works hardest.
The Traffic Channel Report answers the budget question: which channels bring the best results for the money? It puts every source on one screen – Meta Ads, Google Ads, organic search, AI search, social, referral and direct – so you can compare them like for like and shift spend to what's working.
Where to find it
Open Reports → Traffic Channel Report, or go to app.leadjourney.io/?slug=traffic-channel-report.
What it shows
Each row is a traffic channel, with the metrics you'd use to judge it side by side – typically clicks, impressions, cost, CPC, CTR, CPM, leads, CPL, won clients, revenue, ROAS and profit. Use column presets (or the column-visibility settings) to choose exactly which metrics appear and in what order.
Drill down
This report is a hierarchy, not just a list:
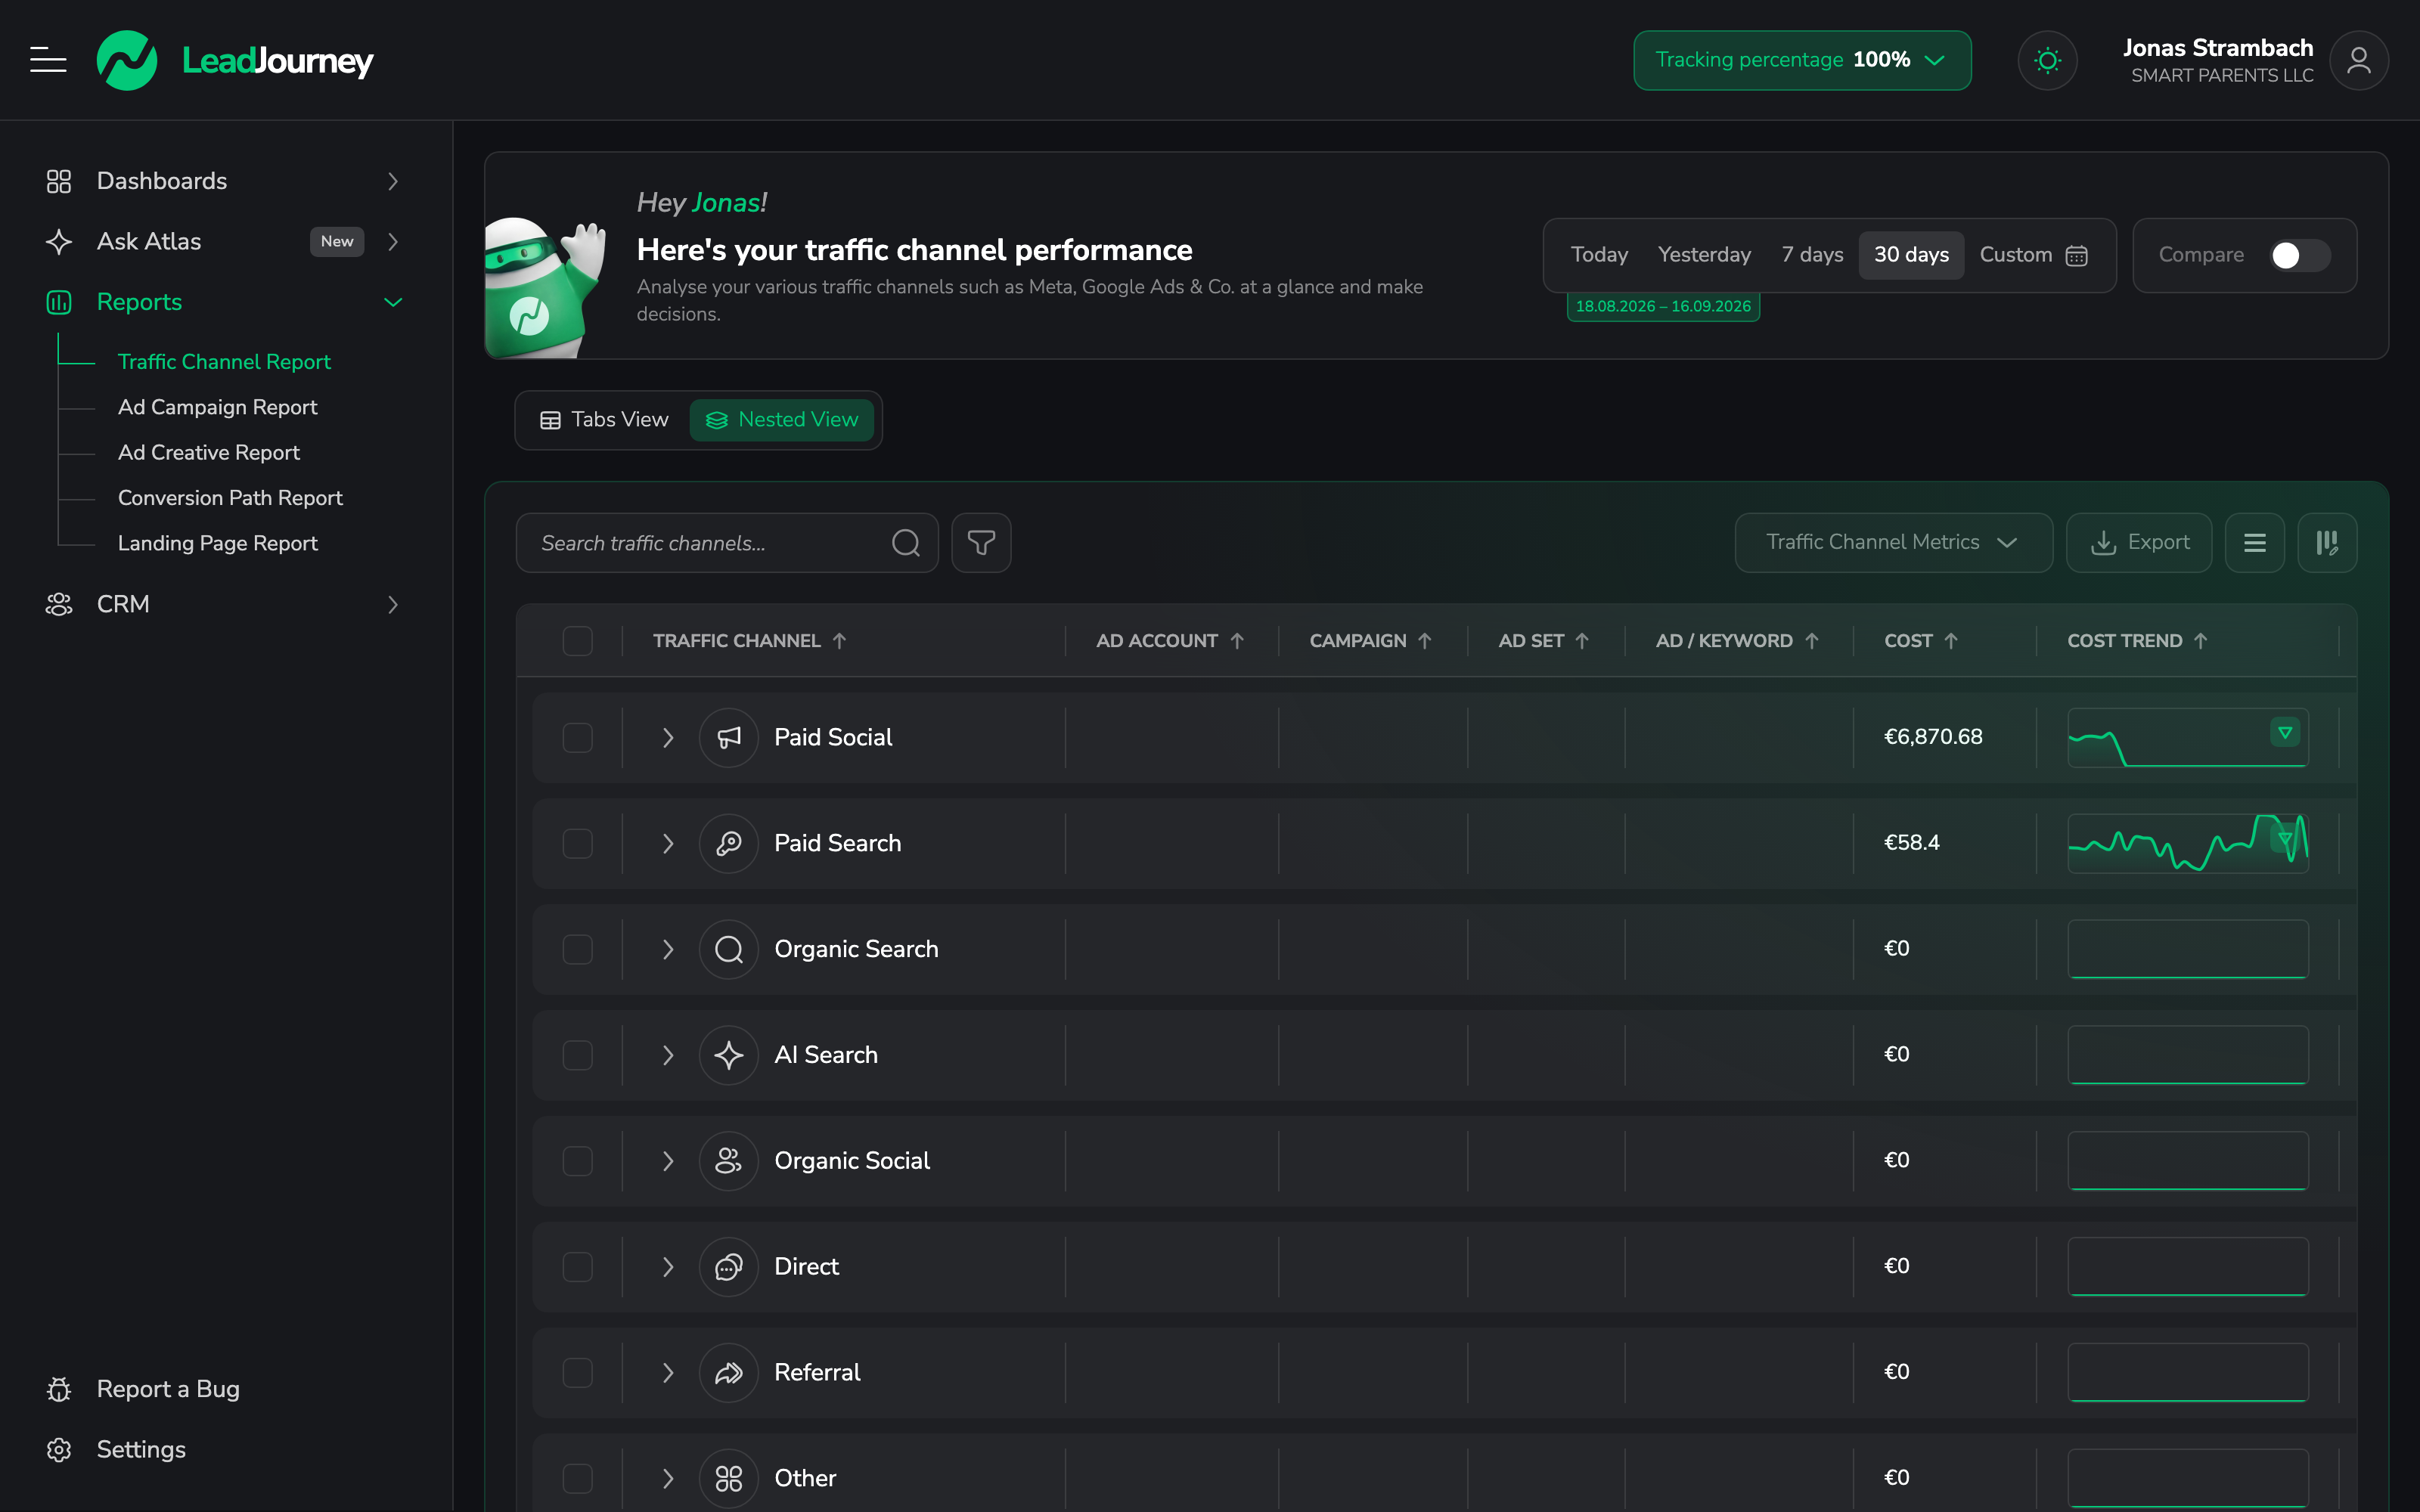
- Start one level above the channels on the Channel Category tab – Paid Social, Paid Search, Organic Search, AI Search and the rest – when the question is about surfaces rather than individual channels. See Channel Category.
- Expand a channel to reveal its ad accounts → campaigns → ad sets → ads/keywords.
- Click a channel to jump into the Campaign Report pre-filtered to it.
- Switch between Tabs and Nested views depending on whether you want to step through levels or see the whole tree inline.
Controls
- Date range and Compare to previous period.
- Attribution method (Last Click / First Click), window and attribution date mode.
- Search a channel by name, and filter by status (All / Active / Inactive).
- An affiliate-only toggle, sortable columns, and saveable presets.
See the leads behind a number
Click the leads/sales icon on any row to open Lead Overview filtered to that channel – the individual people behind the totals.
Make the cost numbers complete
Channel cost only includes what LeadJourney can see. Paid platforms sync automatically; add SEO, email and freelancer spend under Channel Costs so CPL and ROI are right for organic channels too.
Related articles
The prebuilt reports
Five ready-made report views – Traffic Channel, Campaign, Landing Page, Ad Creative and Conversion Path – that answer the most common questions without building anything. Drill down and click any number to see the leads behind it.
Channel Category
The level above your traffic channels – Paid Social, Paid Search, Organic Search, AI Search, Organic Social, Direct, Referral and Other. Compare whole surfaces instead of individual channels, in the Traffic Channel Report and the Report Builder.