Features
Conversion Path Report
The complete multi-touch journeys your leads take before they convert – which channels open, assist and close, how many touches it takes and how long it lasts. The report that shows how your channels work together instead of judging each one alone.
Every other report judges a channel on its own. The Conversion Path Report asks the question those reports can't answer: which channels work together, and in what order?
It takes every conversion, walks back through all the touchpoints that led to it, groups identical
journeys and ranks them. The result is the actual sequence your leads move through – Meta Ads → Email → Lead – rather than one winner and a lot of invisible helpers.
In short
Last Click tells you who closed. First Click tells you who opened. The Conversion Path Report shows you the whole journey in between – and how often it happens.
Where to find it
Open Reports → Conversion Path Report, or go to app.leadjourney.io/?slug=conversion-path-report.
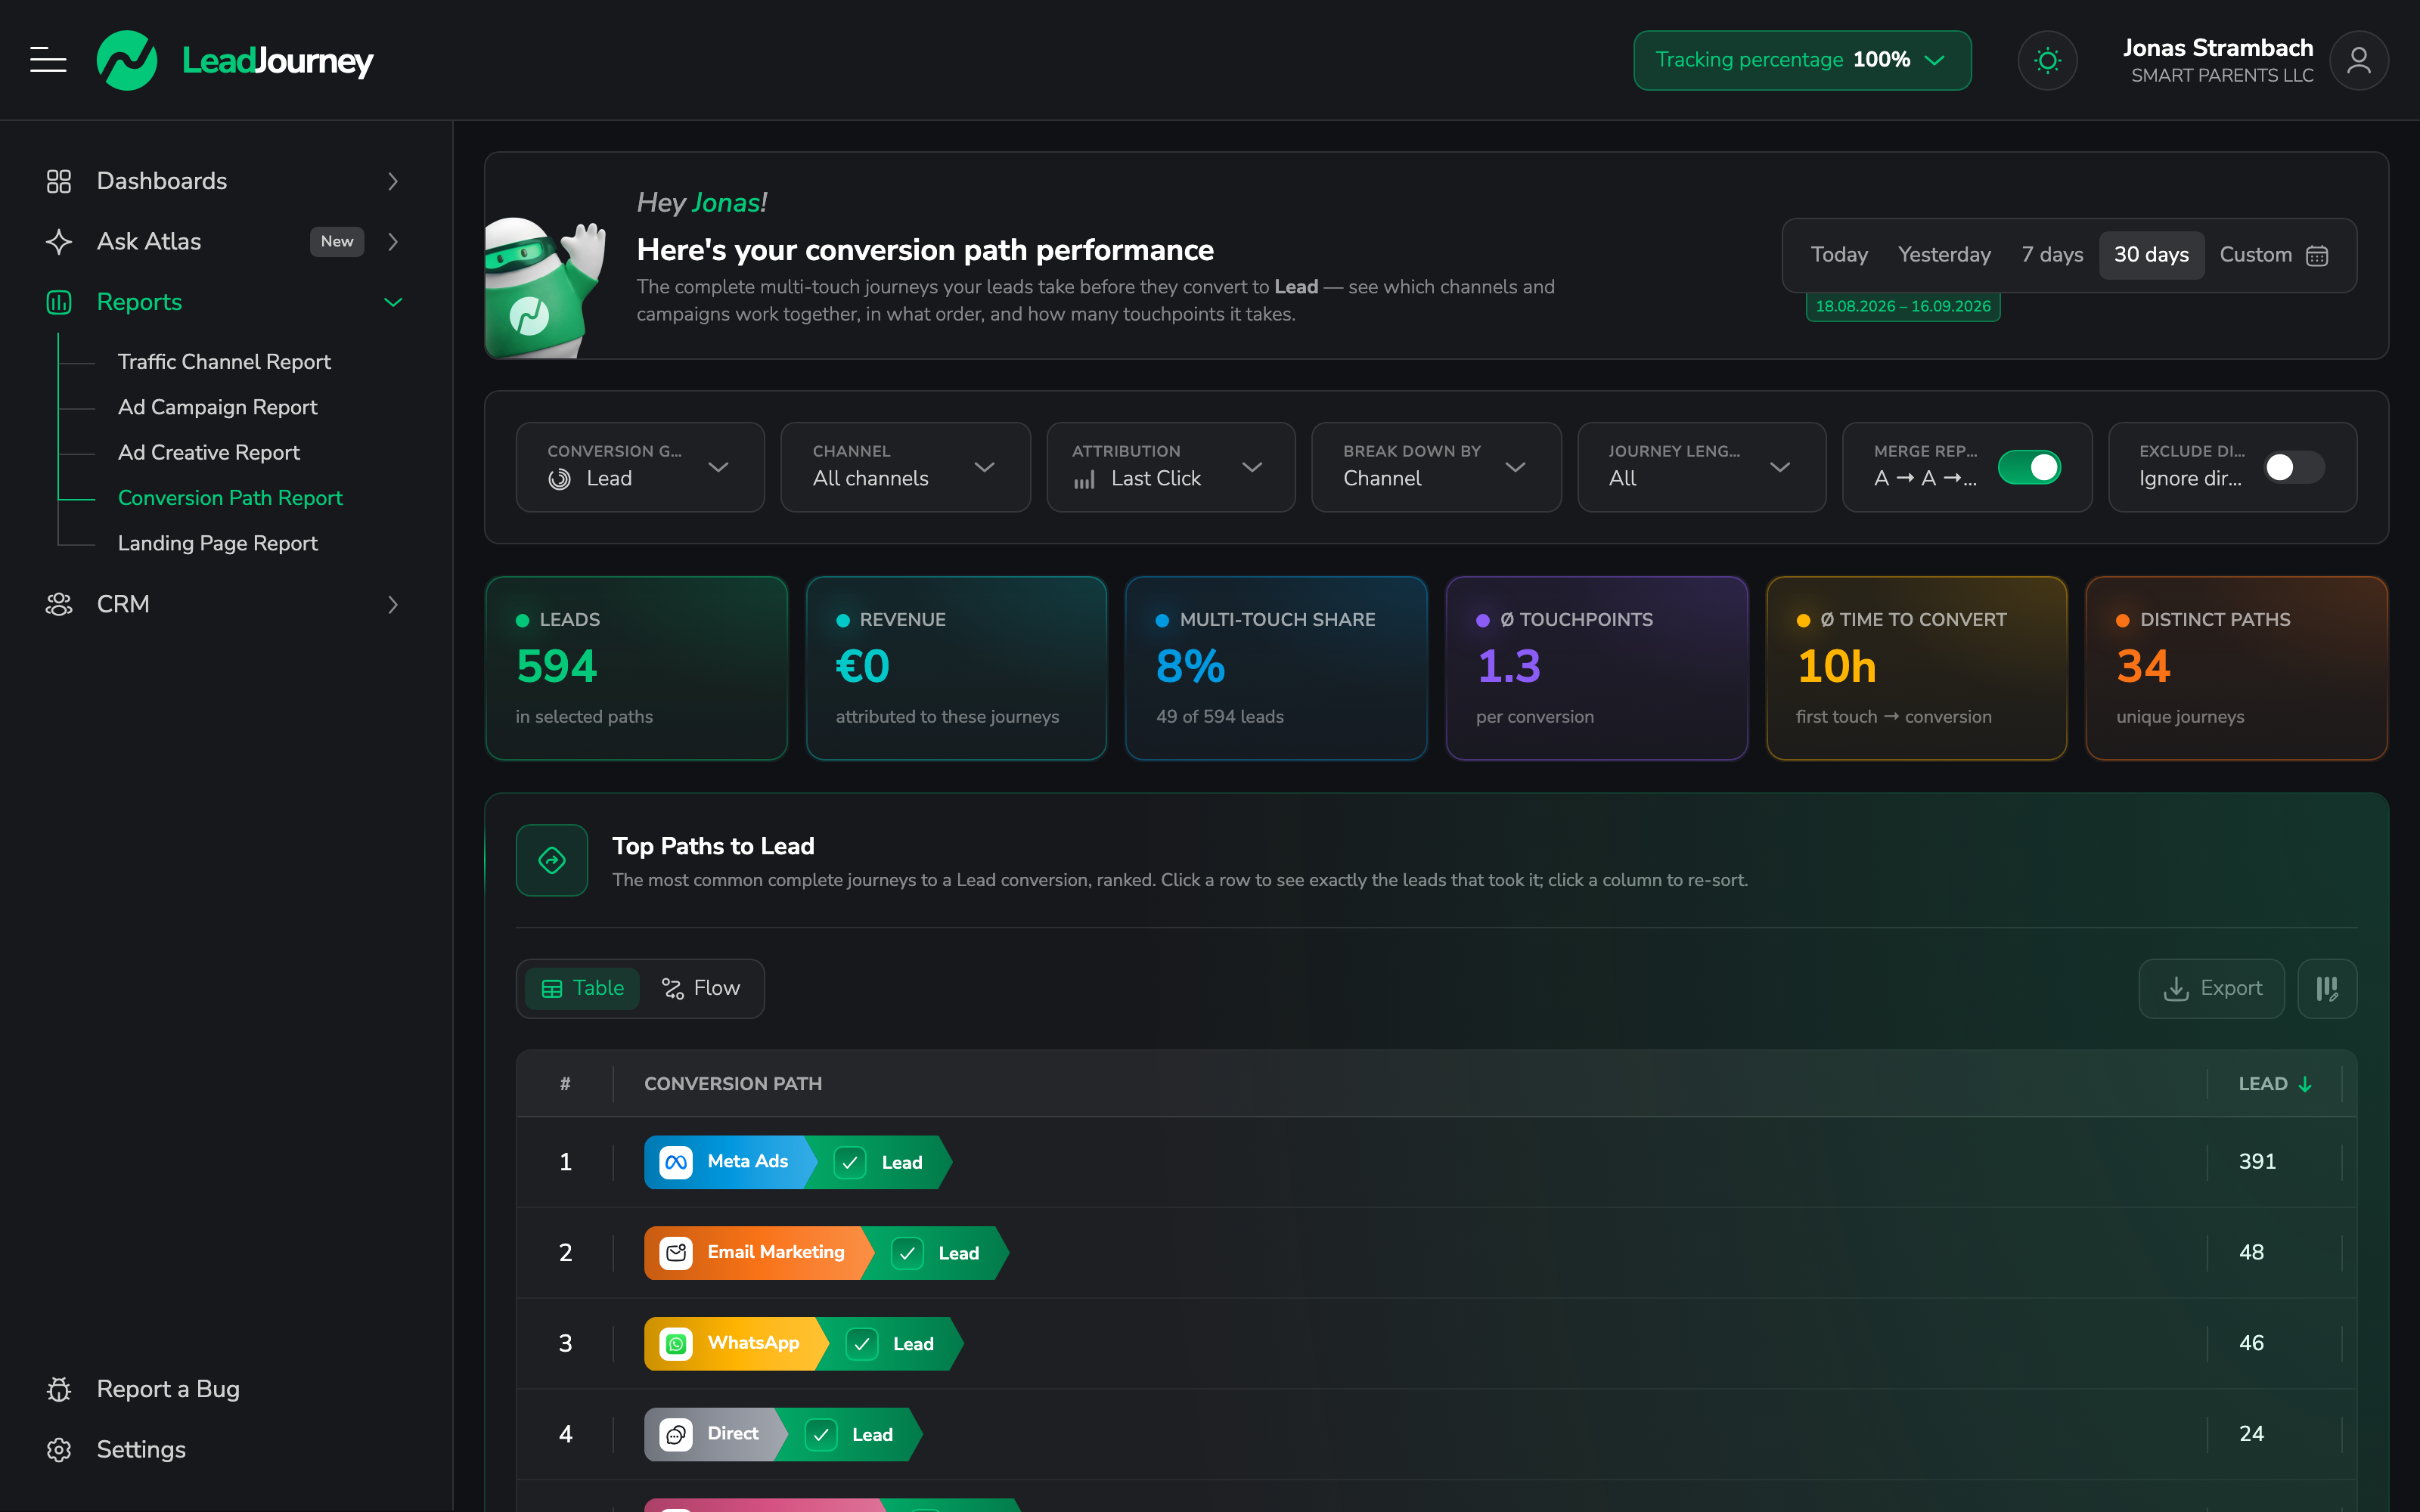
The six numbers at the top

| Metric | What it means |
|---|---|
| Leads | How many conversions are contained in the paths currently shown. |
| Revenue | The revenue attributed to those journeys. |
| Multi-touch share | The share of conversions that took more than one touch. This is the single most useful number on the page – see below. |
| Ø Touchpoints | The average number of touches per conversion. |
| Ø Time to convert | How long it takes from first touch to conversion. |
| Distinct paths | How many genuinely different journeys exist in the selected period. |
Read the multi-touch share first
If it's low, most people convert on the first touch – single-channel thinking is roughly right for your funnel, and Last Click isn't lying to you. If it's high, a lot of your budget is doing work that Last Click never credits, and the paths below tell you which channels are doing it.
The controls

- Conversion goal – the conversion the journey has to end in (Lead, a booked call, a sale, any event you've defined). Everything on the page is measured towards this goal.
- Channel – restrict to journeys that involve one channel. Combined with the attribution setting this becomes powerful: see below.
- Attribution – whether the chosen channel has to have opened the journey (First Click), closed it (Last Click), or merely taken part.
- Break down by – the level each step is described at: Category, Channel, Campaign, Landing Page or Ad / Keyword.
- Journey length – All, Multi-touch (2+) or 3+ touches.
- Merge repeats – folds consecutive touches on the same source into one step, so
Meta → Meta → Leadreads asMeta → Lead. - Exclude Direct – hides Direct touches, which are often just a returning visitor rather than a channel doing work.
Categories are always merged
When you break down by Category, repeated touches are merged whether or not the toggle is on – two consecutive "Paid Ads" touches would otherwise read as a step that means nothing.
Top paths, as a table or a flow
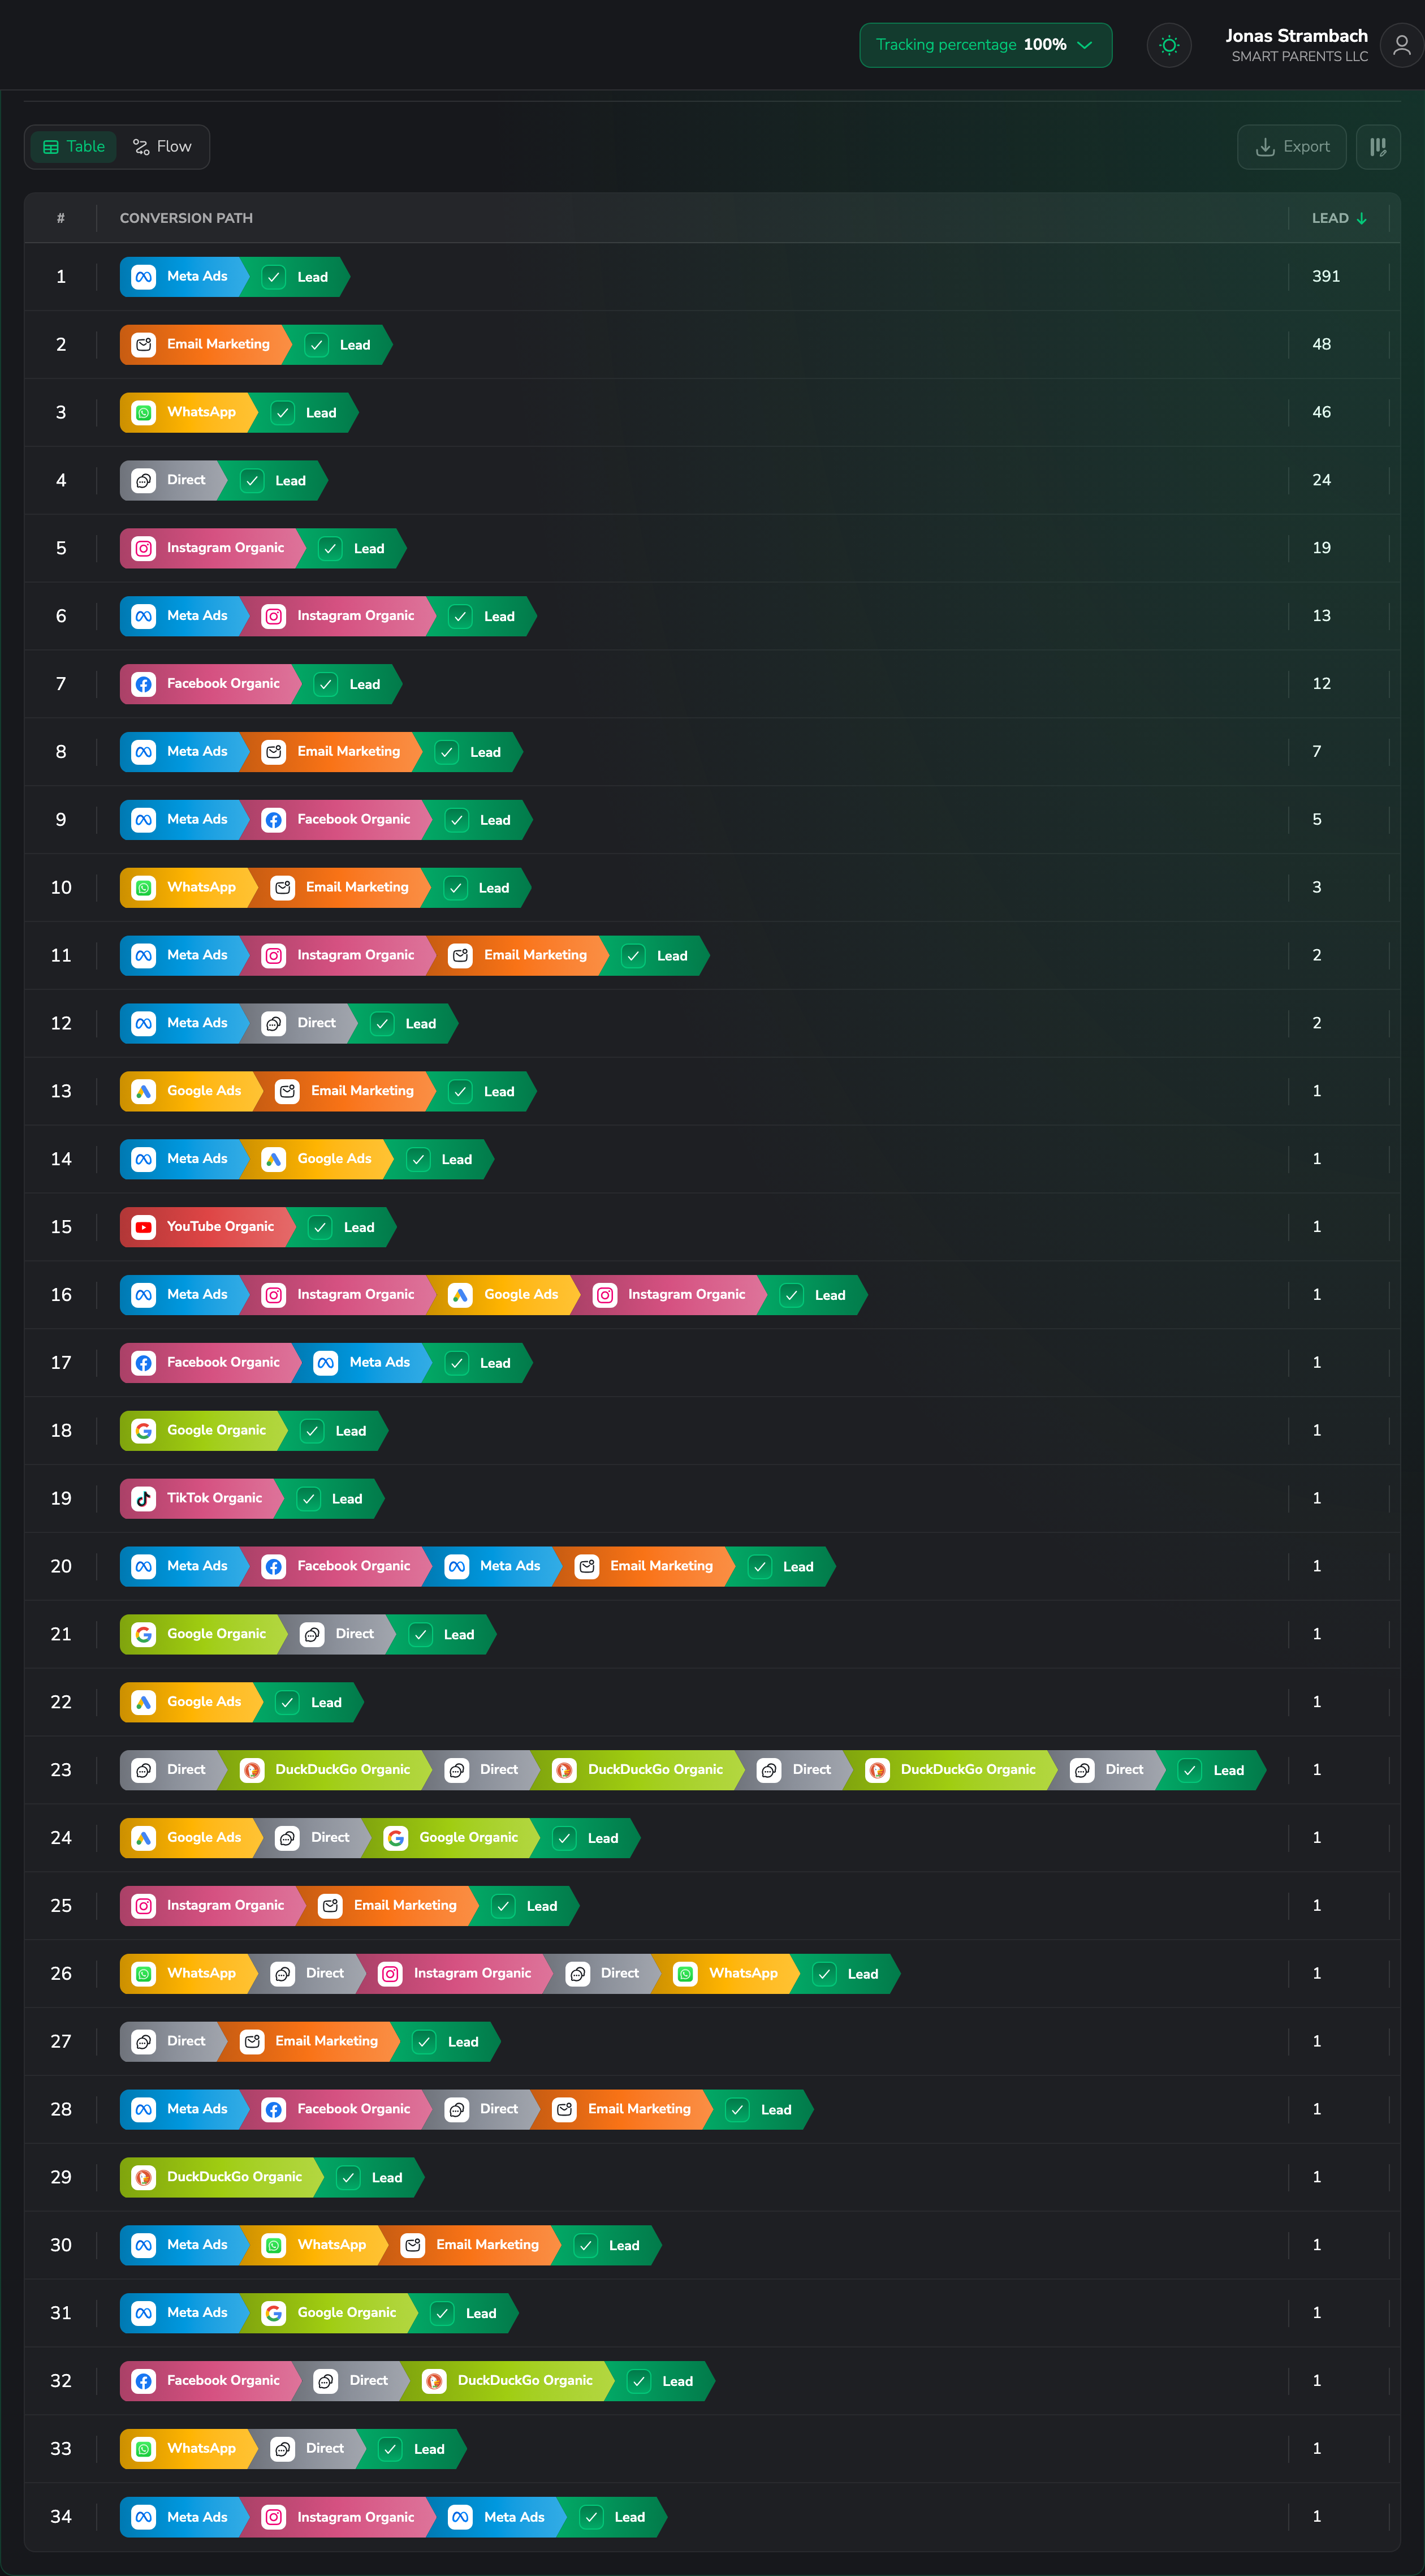
The main card ranks the most common complete journeys to your goal. Click a row to see the individual leads that took exactly that path; click a column header to re-sort.
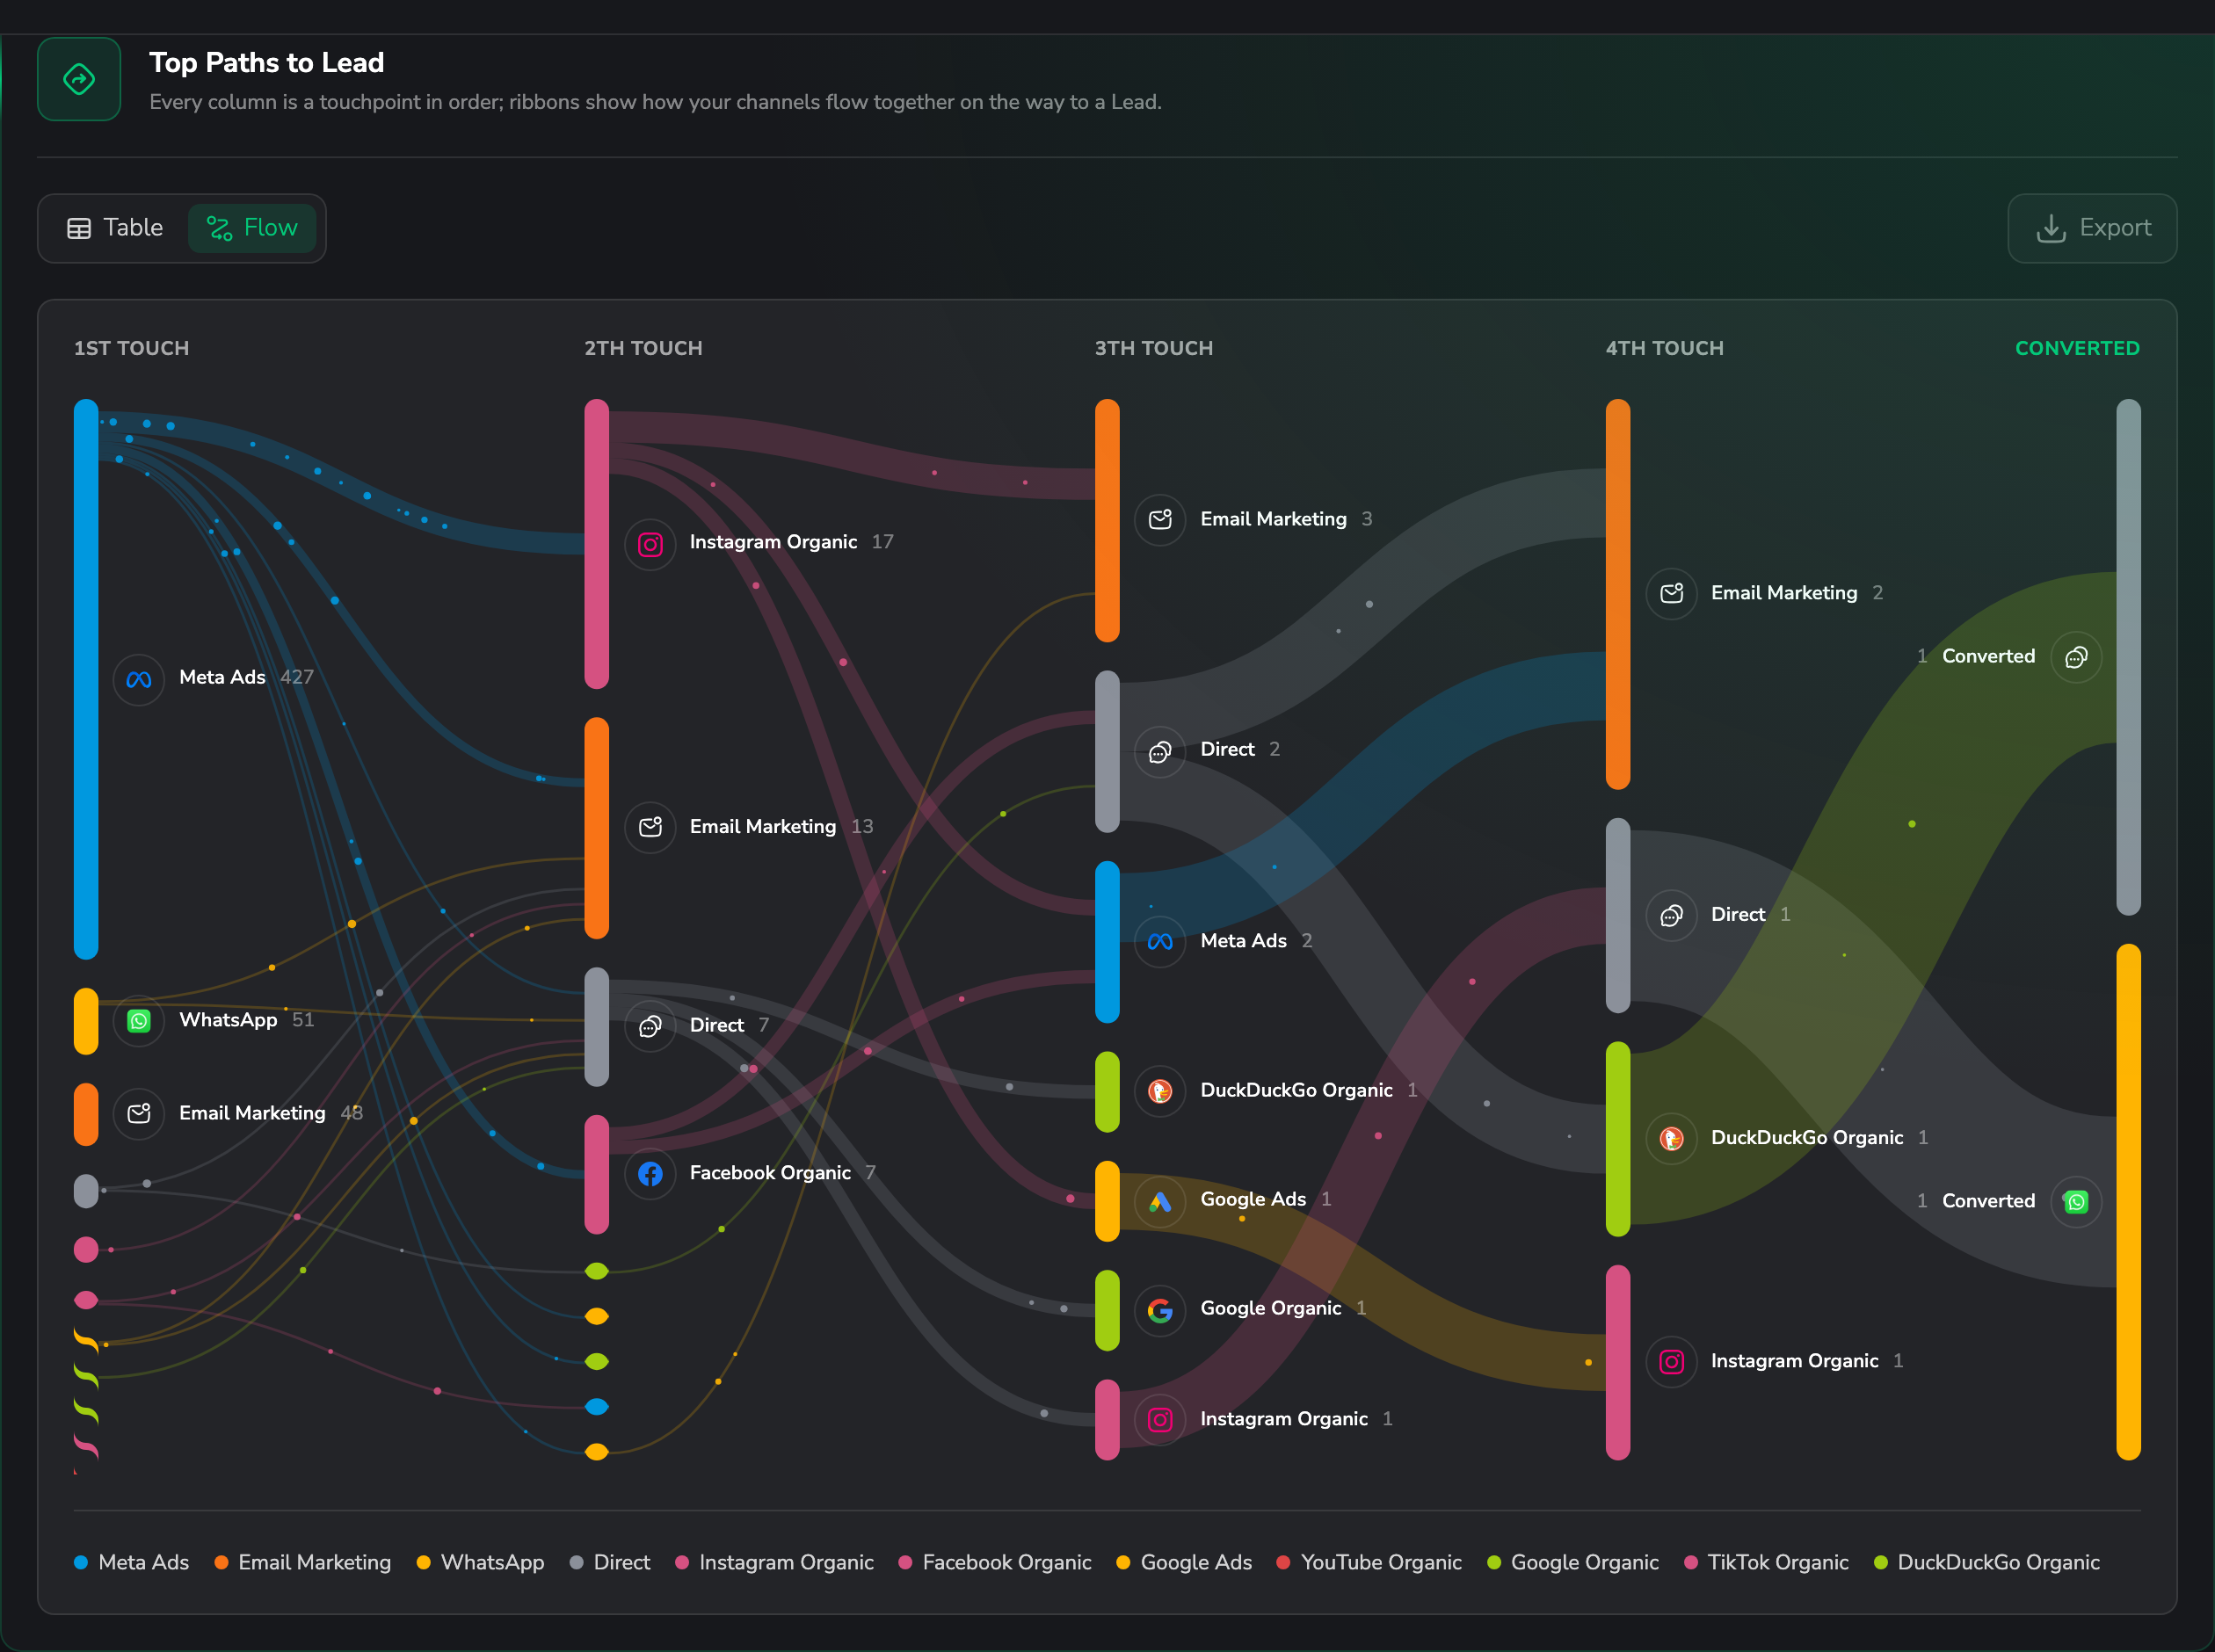
Switch to Flow for the same data as a sankey diagram – every column is a touchpoint in order, and the ribbons show how channels hand over to each other on the way to a conversion.
Touchpoints and channel roles
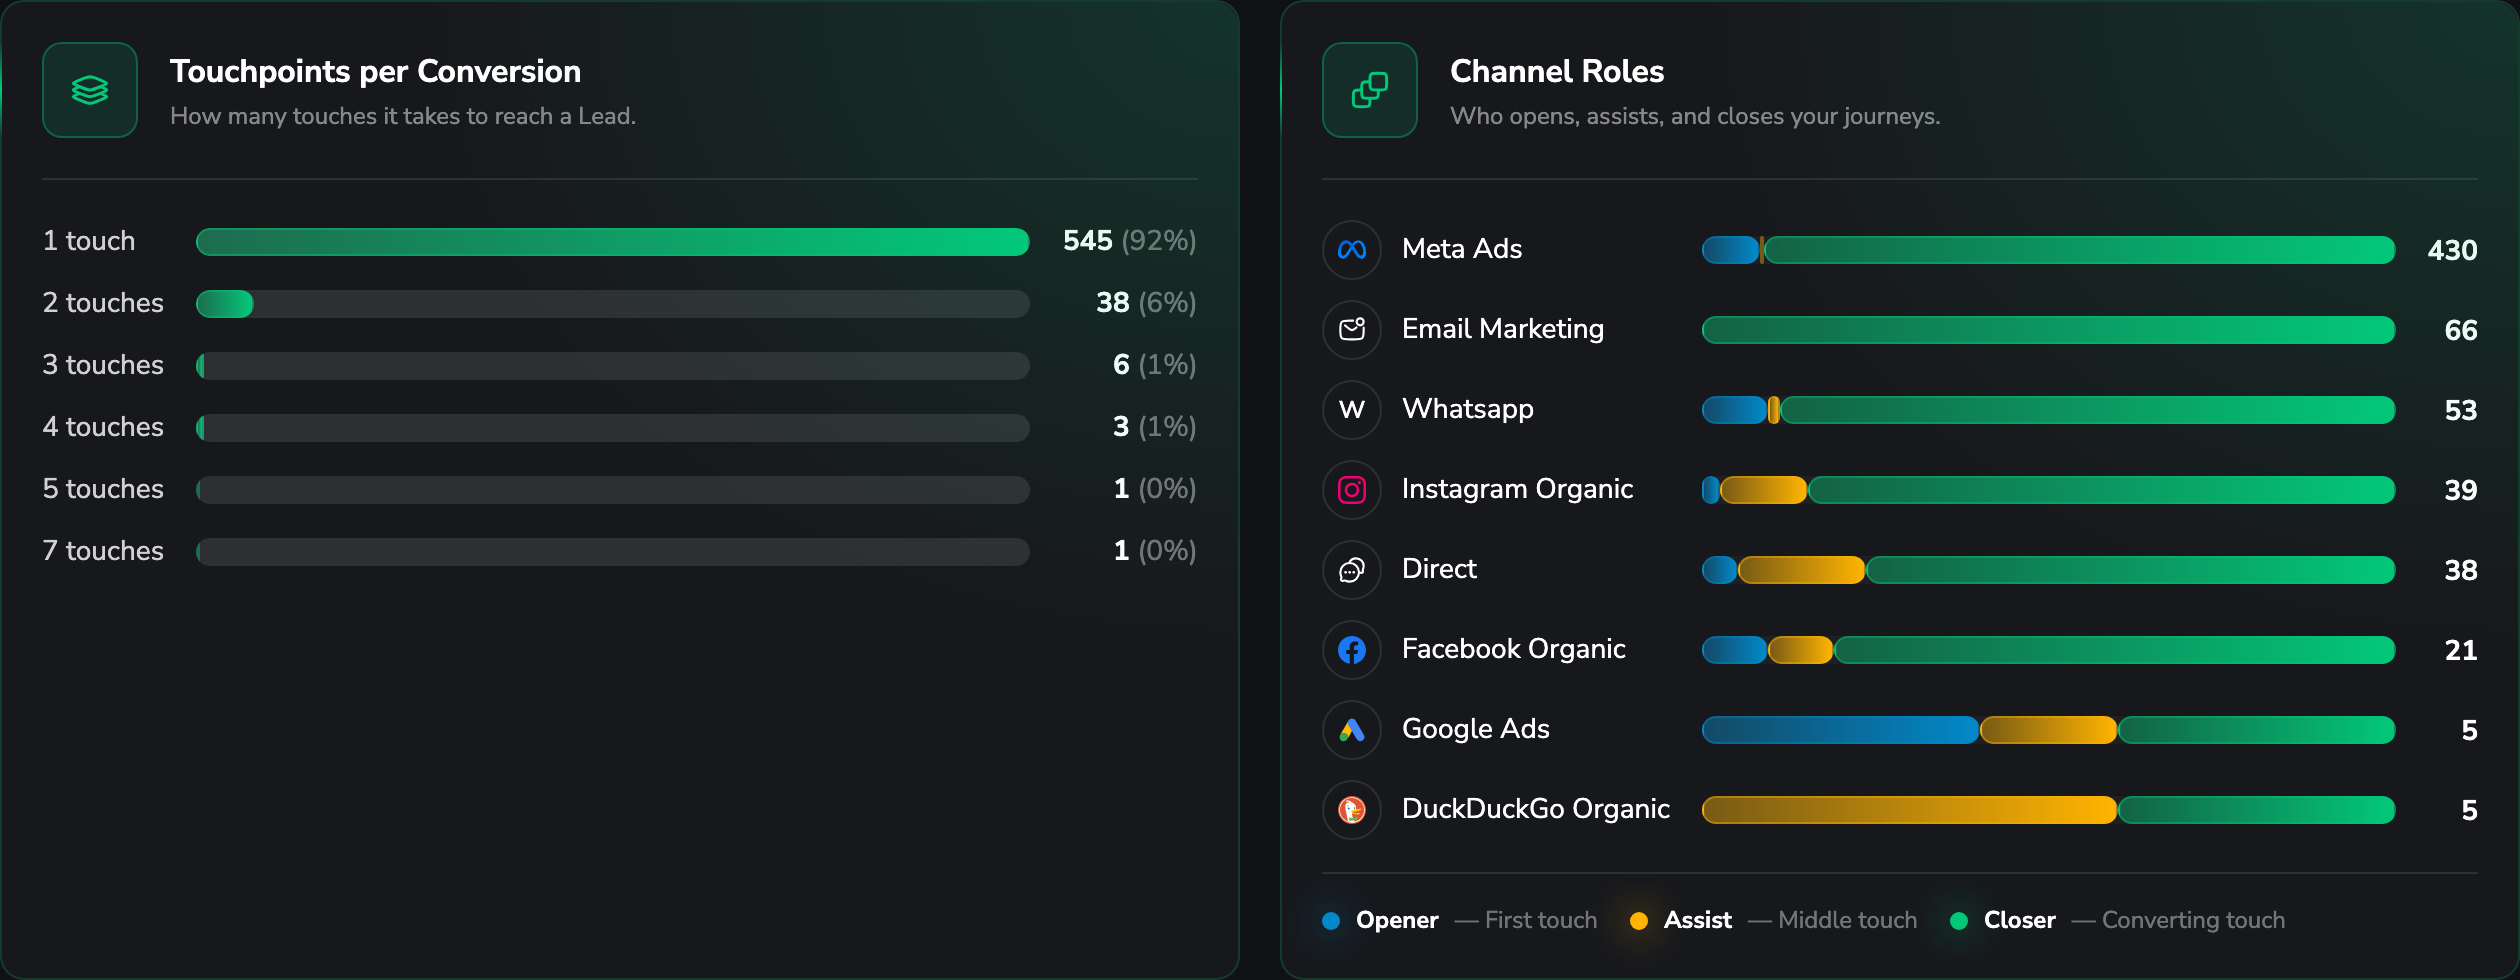
Touchpoints per Conversion shows how the conversions distribute across journey lengths – how much of your business closes on the first touch versus how much needs five.
Channel Roles is the chart to bring to a budget discussion. Each channel is split into:
- Opener – it was the first touch, so it created the demand.
- Assist – it was a middle touch, so it kept the lead moving.
- Closer – it was the converting touch.
A channel that is almost entirely Opener will look weak in a Last Click report and strong here. That mismatch is usually the reason a channel keeps getting its budget cut despite working.
A question worth asking regularly
Set Channel to the one you're unsure about and Attribution to First Click. You now see only the journeys that channel started. Compare the lead count against what the Traffic Channel Report credits it with under Last Click. The gap is the work that channel does without ever getting the credit.
Common questions
Related articles
Ad Creative Report
Benchmark your ad creatives across Meta, Google and LinkedIn to find the winners by CPL, ROAS or leads. View them as a visual gallery, a compact list or a full metric table, with medals for the top creatives per channel.
Lead Overview
Every lead in one table, with first- and last-touch source, CRM status, tags, revenue and full journey. Click any lead to see its complete timeline of clicks, conversions and sales – the person behind the numbers.