Features
Dashboards
Pin your saved reports as cards on a dashboard so the numbers you care about are one click away. Create multiple dashboards, arrange the cards in a grid, and jump back into any report to edit it.
A Dashboard is a page of saved reports, shown as cards. You build a report in the Report Builder, pin it to a dashboard, and from then on it's there whenever you open it – no rebuilding. Most teams keep one dashboard per topic (Paid overview, Lead quality, Affiliate) and check them at a glance.
In short
The Report Builder makes reports; Dashboards keep them. A report only sticks around if you Add it to a dashboard – that's where your saved views live.
Where to find it
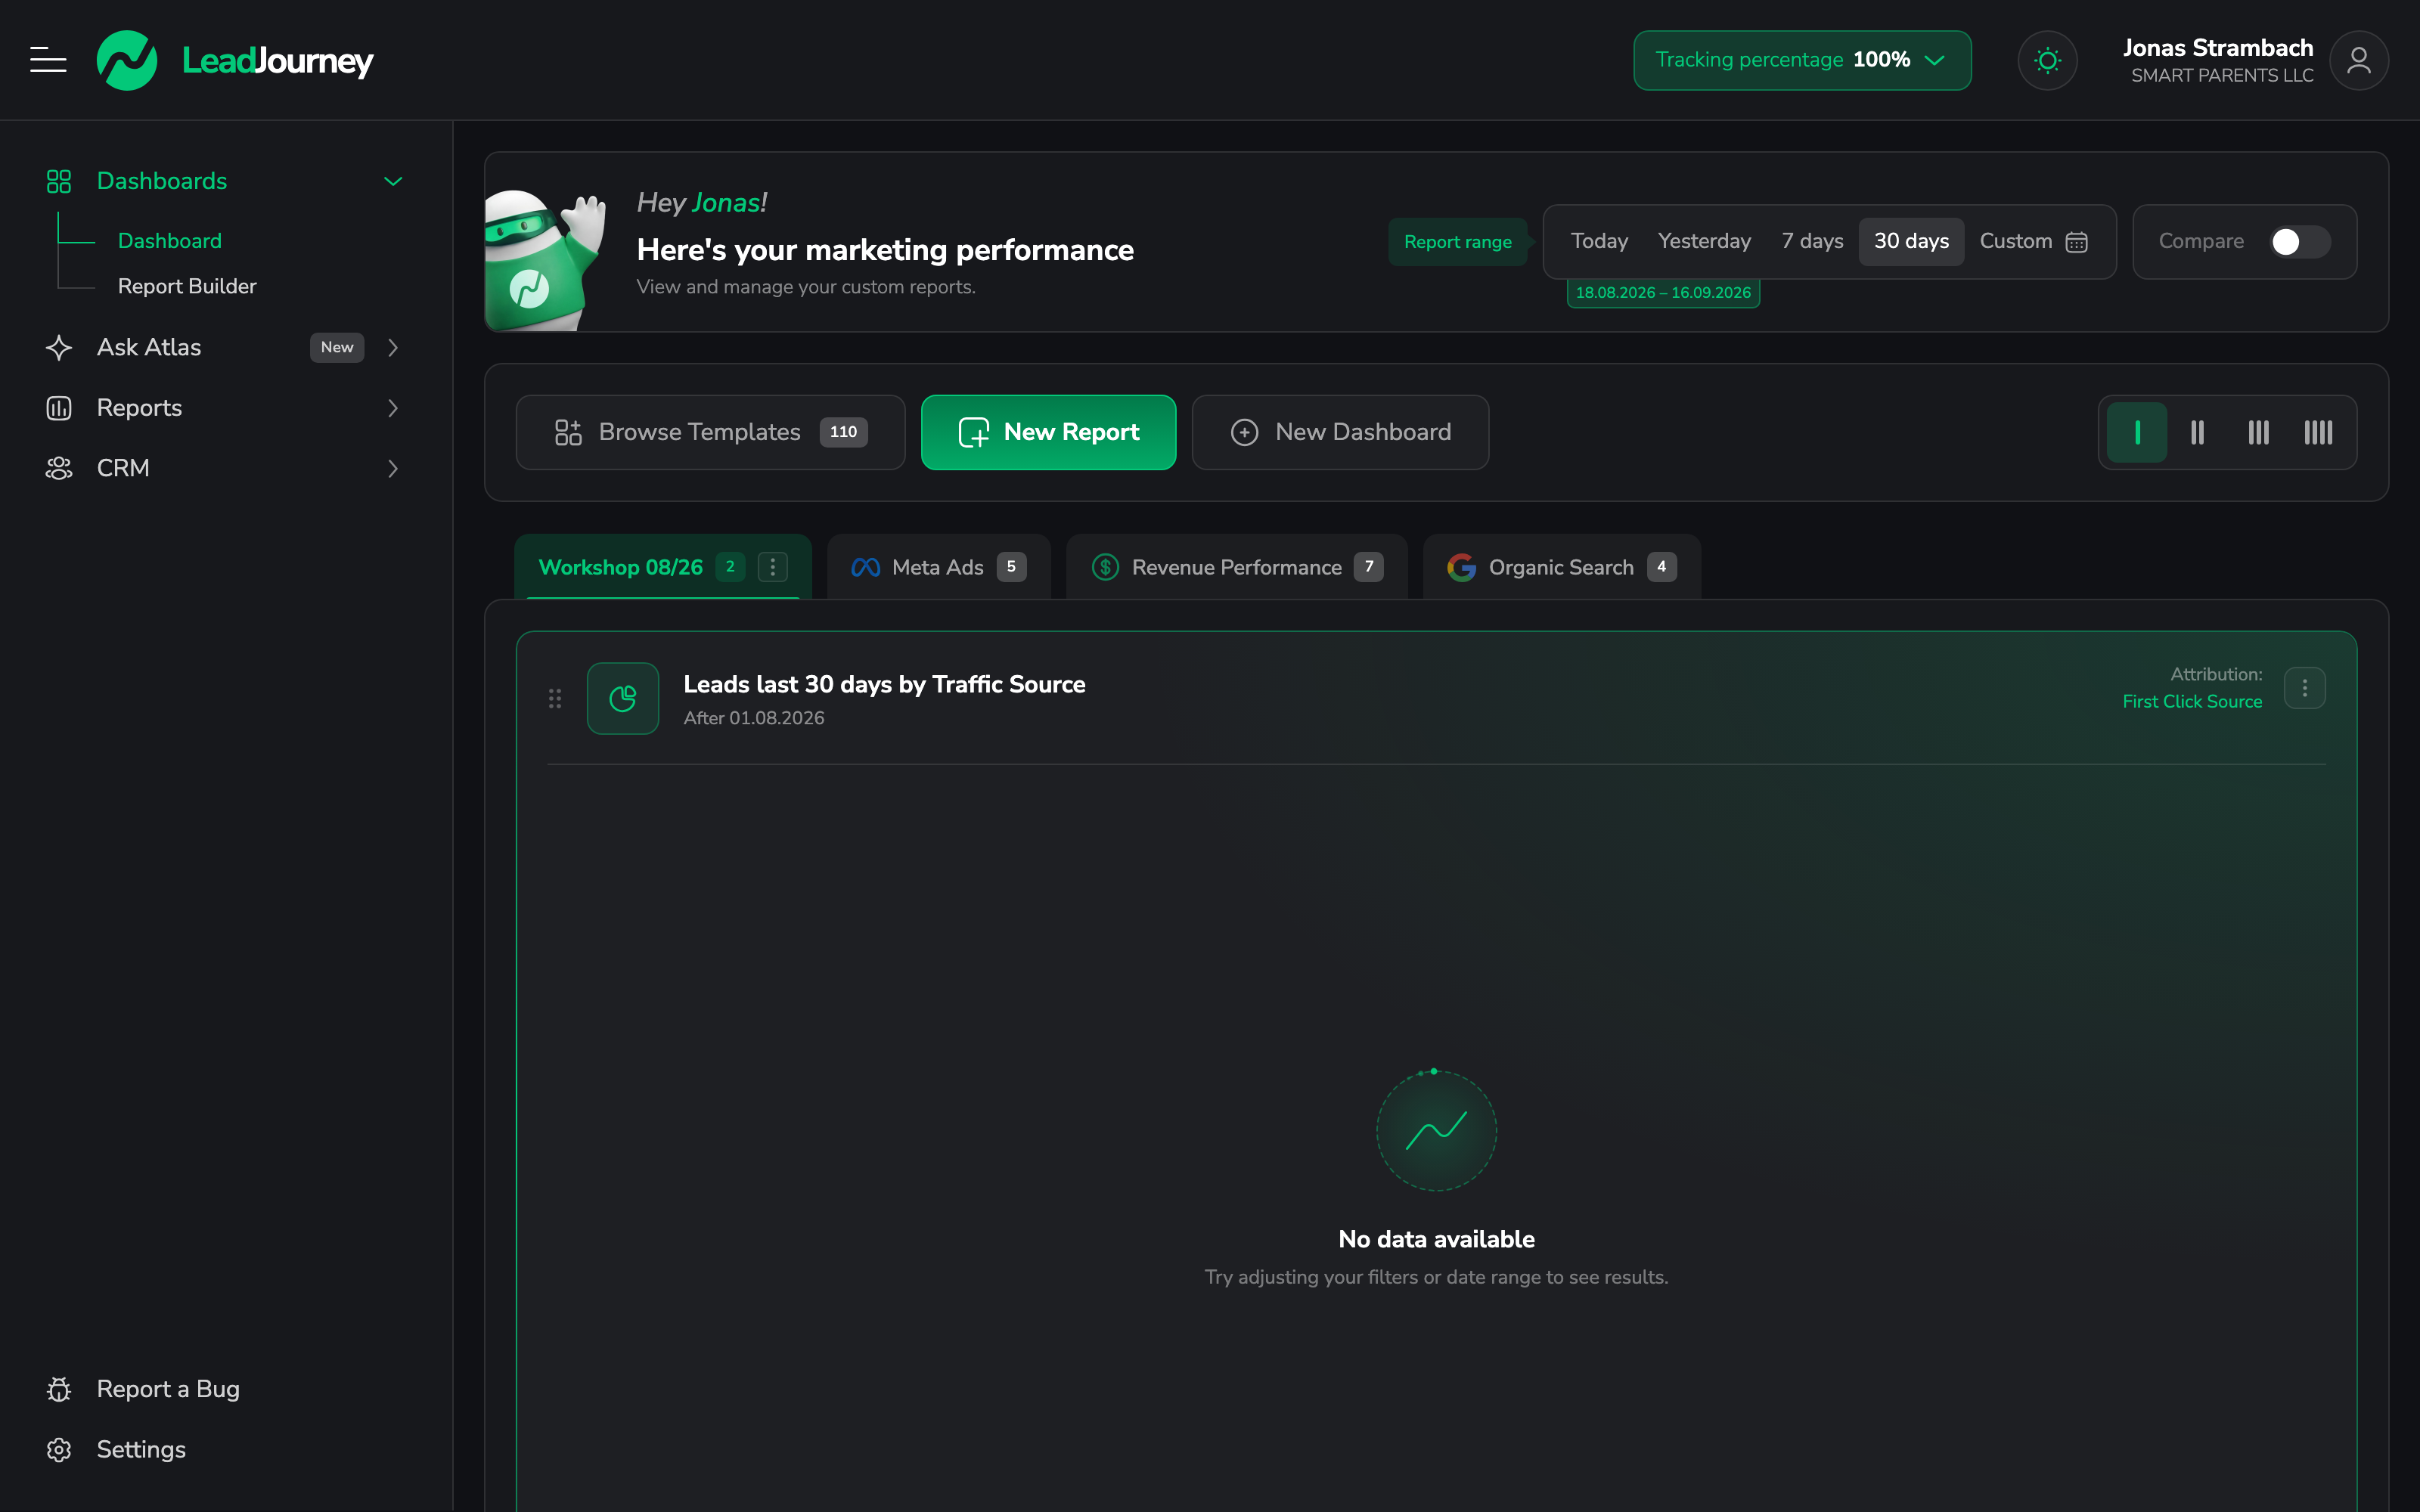
In the left sidebar open Reports → Dashboard, or go to app.leadjourney.io/?slug=dashboard. The page header reads Dashboard – "View and manage your custom reports."
If you don't have any dashboards yet, you'll see a No Dashboards empty state with two buttons – New Report (opens the Report Builder) and New Dashboard.
Create a dashboard
Open the new-dashboard dialog
Click New Dashboard in the header (or Create New Dashboard from the Add to Dashboard menu in the Report Builder).
Name it and create
Type a Dashboard name and click Create. The dashboard appears as a tab below the header, with a badge showing how many reports it holds.
You can have as many dashboards as you like. Each shows as its own tab, and you can drag the tabs to reorder them.
Add reports to a dashboard
Reports come from the Report Builder. Build one, click Add To Dashboard, and pick the dashboard (or create one on the spot). See Report Builder → Save a report to a dashboard.
A dashboard with no reports yet shows: "No reports yet. Use the Report Builder to create and add reports to this dashboard." with a Go to Report Builder button.
Work with the report cards
Each report is a card in a grid. On every card:
| Action | How |
|---|---|
| Edit the report | Card menu (⋯) → Edit Report – opens the Report Builder with every setting pre-filled. Save to update the card. |
| Remove the report | Card menu (⋯) → Delete Report – takes it off this dashboard. |
| Reorder cards | Drag a card to a new position; the layout saves automatically. |
You also control how many cards sit side by side with the column selector (1, 2, 3 or 4 columns). The choice is remembered per dashboard.
Each card keeps its own date range
A report card uses the date range it was saved with. Relative ranges stay relative – a card saved as This Month always shows the current month when you open it. There's no single date filter across the whole dashboard; change a card's range by editing the report.
Rename or delete a dashboard
On the active dashboard tab, open the three-dot menu (⋯):
- Rename – edit the name inline.
- Delete – removes the dashboard. You'll be asked to confirm: "Are you sure you want to delete '…' and all its reports?"
Deleting a dashboard removes its cards
Deleting a dashboard deletes the report cards on it. The underlying tracking data is untouched – you can always rebuild the report in the Report Builder – but the saved card configuration is gone.
Common questions
Related articles
Report Builder
Build custom reports from any metric, dimension, date range and filter – then visualise them as a chart or table and pin them to a dashboard. LeadJourney's flexible reporting tool.
The prebuilt reports
Five ready-made report views – Traffic Channel, Campaign, Landing Page, Ad Creative and Conversion Path – that answer the most common questions without building anything. Drill down and click any number to see the leads behind it.