Features
Landing Page Report
See how each landing page converts across every traffic source – clicks, leads, conversion rate, won clients and revenue, with a per-page conversion trend. Group a page's traffic by channel, campaign, device and more.
The Landing Page Report shifts the focus from where traffic comes from to where it lands. It shows how each page on your site converts, so you can spot the pages doing the heavy lifting and the ones leaking traffic.
Where to find it
Open Reports → Landing Page Report, or go to app.leadjourney.io/?slug=landing-page-report.
What it shows
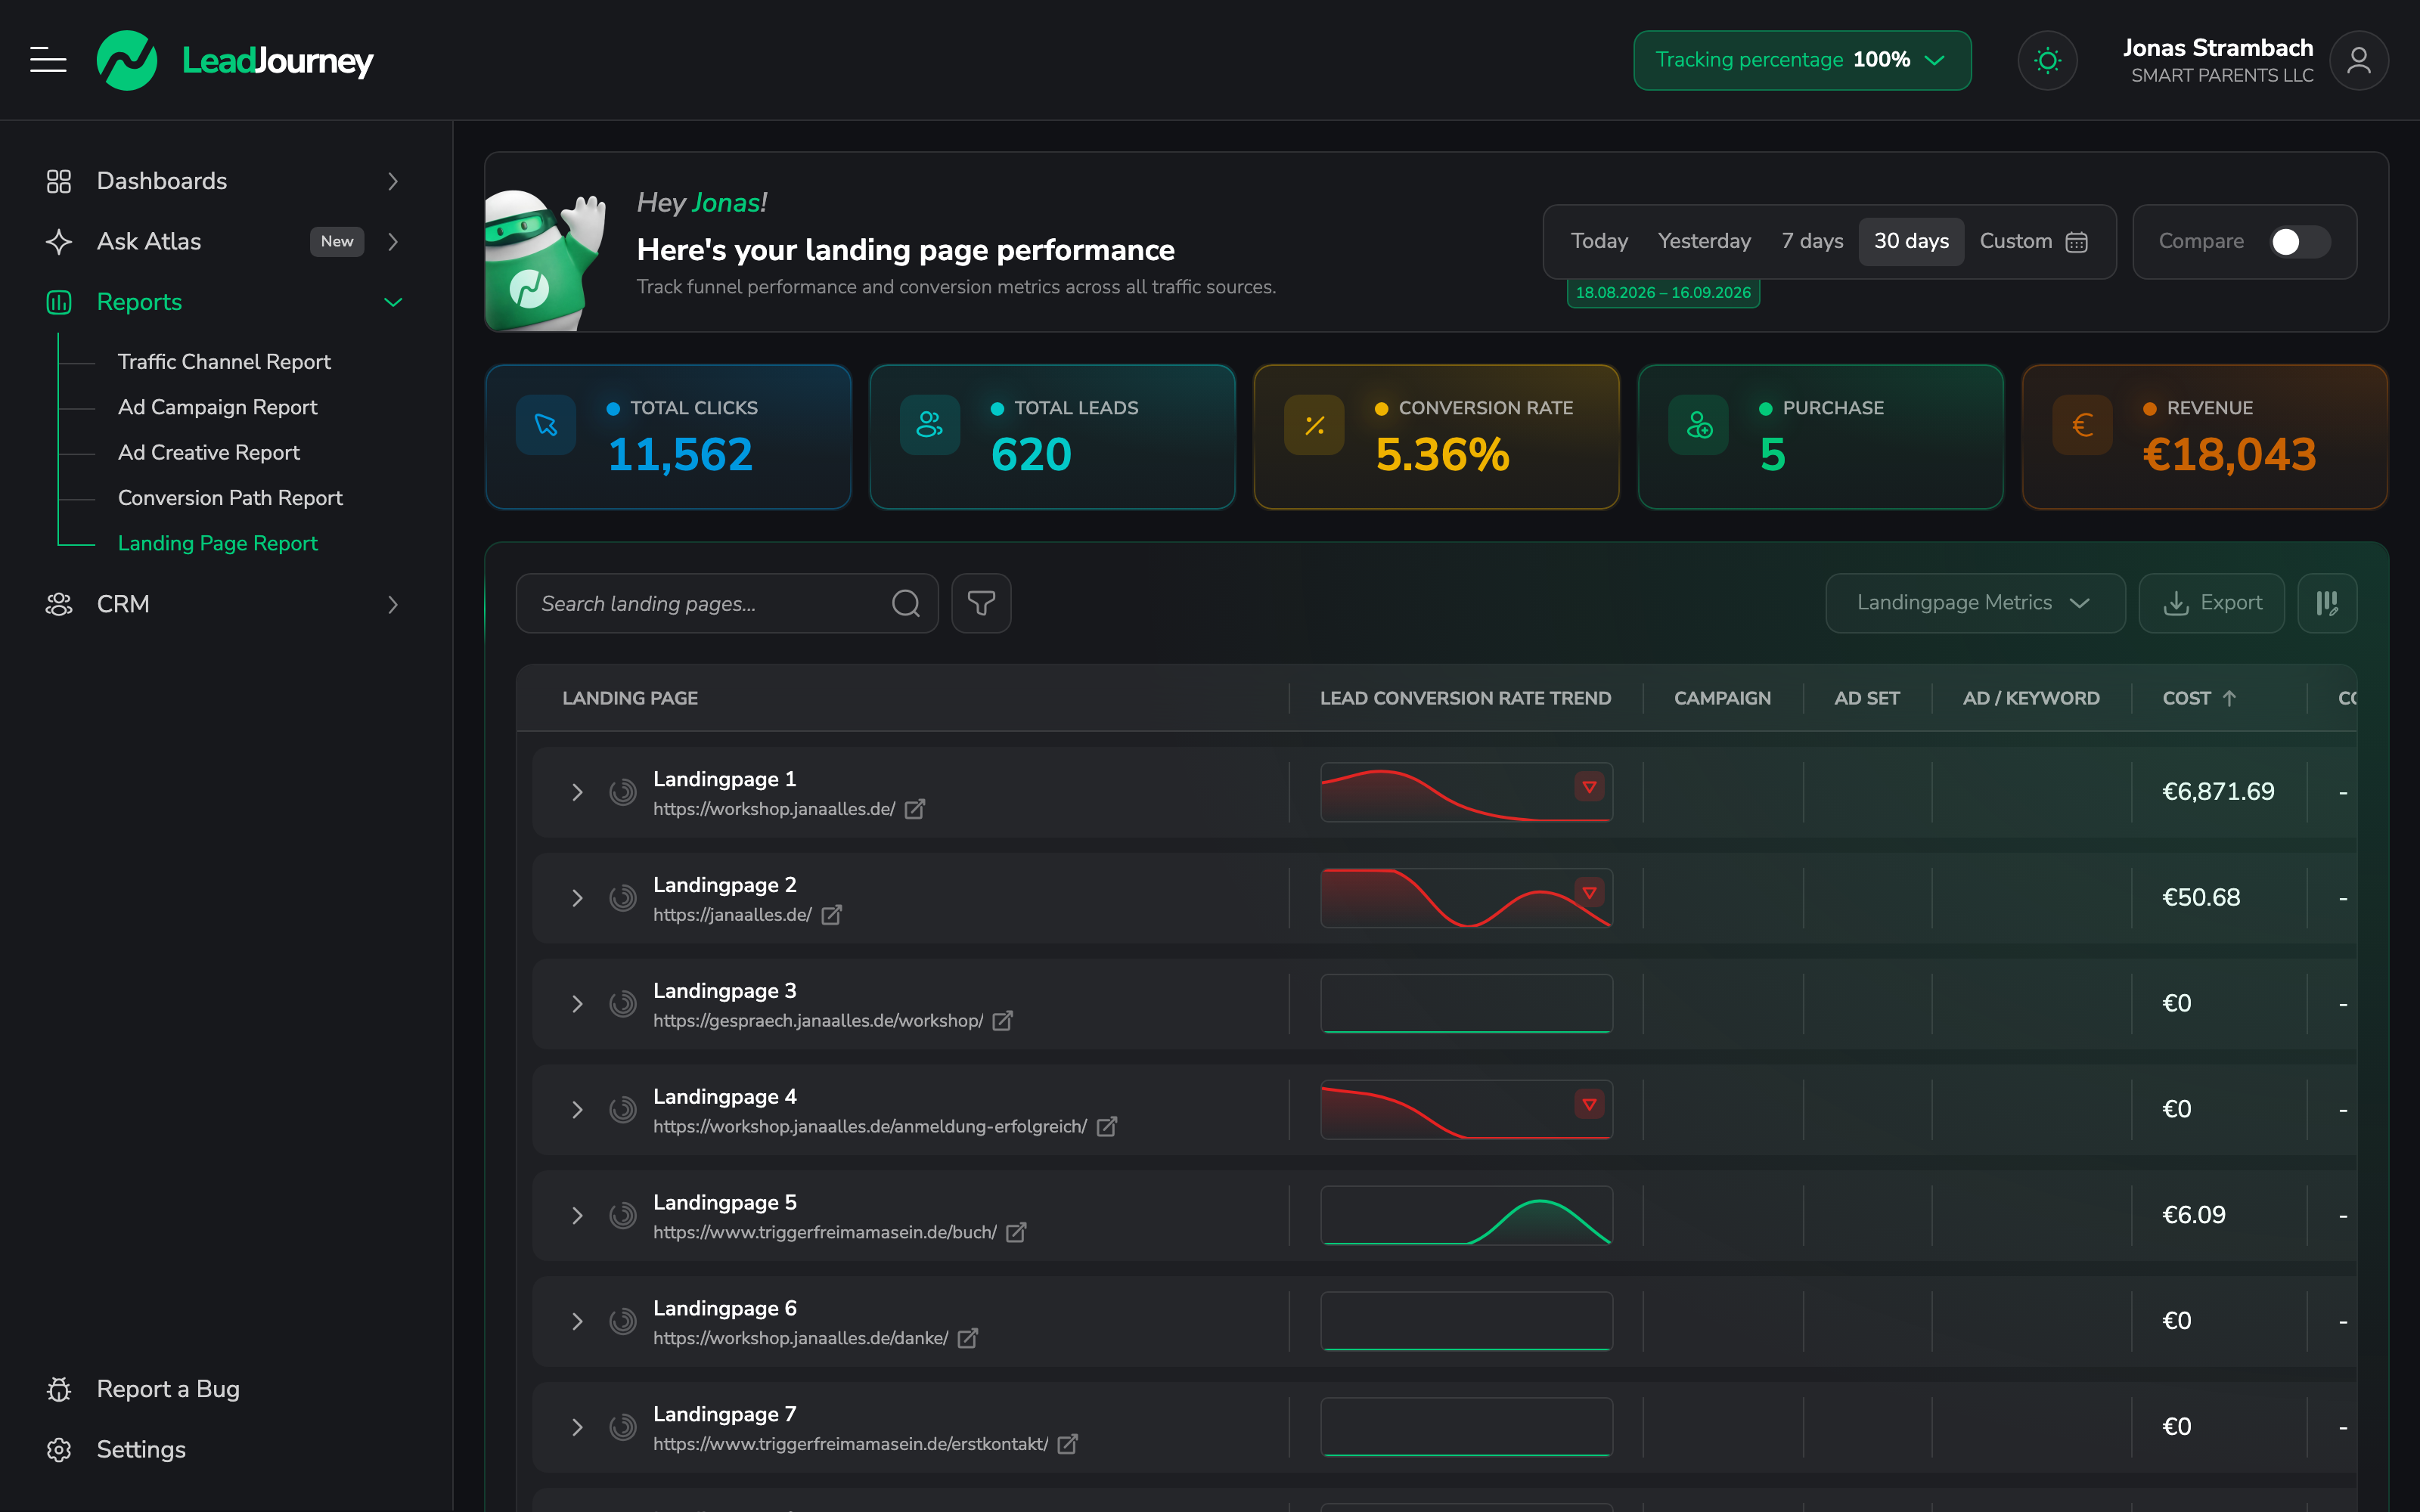
Each row is a landing page (the entry URL), with a small conversion-trend sparkline and metrics such as clicks, leads, conversion rate, won clients and revenue. You can rename a page to a friendly label so reports read clearly.
Group a page's traffic
Expand a page to break its traffic down by a dimension – Traffic Channel (the default), Campaign, Ad Set, Ad, Device, Country, City, ISP, Connection Type, OS or Browser – so you can see which sources convert best on a given page, and drill further from there.
Controls & row actions
- Date range, Compare to previous period, attribution method (Last Click / First Click) and date mode.
- Search by URL or custom name, a group-by selector and advanced filters.
- Sortable columns with presets, and CSV export.
- Analyze with Atlas AI – send a page's data straight to Ask Atlas for a written read-out.
See the leads behind a page
Click the leads/sales icon on any row to open Lead Overview filtered to that landing page.
Related articles
Campaign Report
Drill into campaign performance across every channel, then expand campaign → ad set → ad/keyword. Group each level by country, device, OS and more to find the winners to scale and the losers to cut.
Ad Creative Report
Benchmark your ad creatives across Meta, Google and LinkedIn to find the winners by CPL, ROAS or leads. View them as a visual gallery, a compact list or a full metric table, with medals for the top creatives per channel.